
XLM price prediction: Key highlights
1. Primary support and resistance levels
- Within the weekly timeframe, a support level of $0.07 was identified as the lowest point.
- The highest probable resistance could be marked at $0.39.
2. Market sentiment
- XLM remains in a slightly bullish market in April 2024.
3. Predictive forecasts
- Based on forecasts from our AI/ML models, XLM is projected to trade at an average price of $1.2 in 2026 and $107 in 2032.
Gain deep insights on XLM via a comprehensive weekly technical analysis, followed by the coming days of the month, upcoming months, and yearly forecast tables derived from our AI/ML-based predictive models:
XLM technical analysis: Bulls and bears fight head to head for dominance
While many cryptocurrencies have recorded massive gains, XLM has underperformed in the current bull run. Mapping the past trajectory offers the ground for Stellar price prediction for 2024 and beyond.
At the outset, the asset experienced a setback after encountering initial resistance at the $0.10 mark. The barrier initiated a downward spiral, leading the cryptocurrency to retreat to a low support level of $0.07 in June. This phase of decline was not unique to XLM but highlighted its struggle within the broader market.
Nevertheless, the narrative took a positive turn in mid-June as XLM began to rally. After retesting the $0.10 level by month’s end, XLM broke through this barrier thanks to a significant surge in mid-July. Thus, a new high resistance was established at $0.15.
Yet, this victory was short-lived as the price faced rejection at this newly established peak towards the end of July. This was a classic indicator of an overvalued market, prompting a correction.
The bulls were unable to halt further declines at the immediate support level. This led to XLM ultimately falling back to $0.10 in mid-August. Afterward, XLM’s price oscillated, vying to sustain momentum above $0.12. Despite the brief fluctuations above and below this level, the price consistently found support at $0.10, underscoring its importance as a psychological and technical level for the asset.
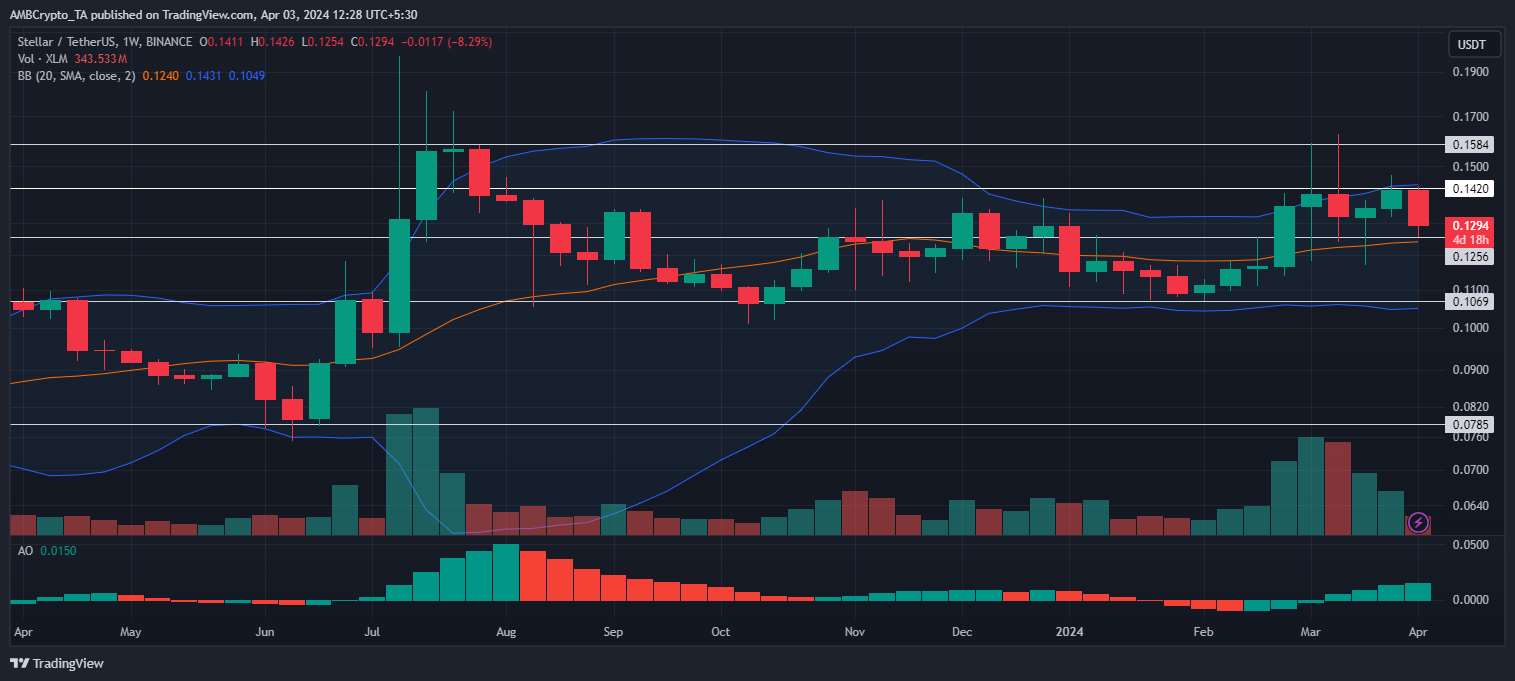
The onset of February marked another bullish attempt as XLM aimed to solidify its standing above $0.12. Towards the end of the month, a price pump enabled XLM to reclaim this level. Following this, the price approached its highest resistance at $0.15. However, it could still not move past the current resistance at $0.14. At the time of writing, the altcoin exchanged hands at $0.129, moving closer to the present support level.
The price has stayed below $0.15 for nearly two years. Overcoming this can trigger a lasting breakout rally. Nonetheless, that would necessitate a significant mobilization from the buyers. This can potentially push XLM toward the $0.2 mark. In a highly optimistic scenario, the price could even surge to $0.39, though this level may also serve as a juncture for potential rejection.
Conversely, a victory for bearish forces, leading to a breach of the current support, could see XLM retreat to the $0.10 level. This can likely trigger the onset of a downtrend. Drawing on predictive models, the analysis forecasts that XLM could trade at an average price of $1.2 by 2026, escalating to $107 by 2032.
This projection not only reflects the expected volatility and challenges in the cryptocurrency market but also highlights the potential long-term growth trajectory for Stellar Lumens, given its ability to navigate through market fluctuations and maintain critical support levels.
XLM’s 2024 roadmap: Key indicators to watch and trade
- XLM’s trading volume remained lackluster up until July. Coinciding with the price touching its peak resistance, significant volume surges became evident.
- However, as the price ebbed, the trading volume mirrored this decline, settling into a more subdued state. Another phase of recovery was observed towards the end of February, aligning with increasing prices. It suggested that the traders might be regaining confidence.
- The Awesome Oscillator (AO) turned positive briefly between April and May, followed by a much more assertive crossover in July. The latter saw the AO reaching an apex of 0.0501 in August. However, this bullish momentum was ephemeral. The positive values started waning, leading the indicator back below zero by late January.
- This again reversed in mid-March as renewed momentum started to build up, bringing the AO to register at 0.0150. It pointed to a potential reversal or the beginning of a new bullish phase.
- Between mid-May and mid-June, the Bollinger Bands experienced a brief contraction as the price fell below the 20-week moving average (MA). The trend reversed, and expansion resumed in late June as the price moved above the 20…
Read More: Stellar Price Prediction: 2024, 2025, 2030