
The price of Litecoin (LTC) and investors have been reeling from the massive 30% decline LTC observed in early April.
But before the altcoin could recover from this, the investors seem to be choosing a different, more bearish path.
Litecoin investors seek profits
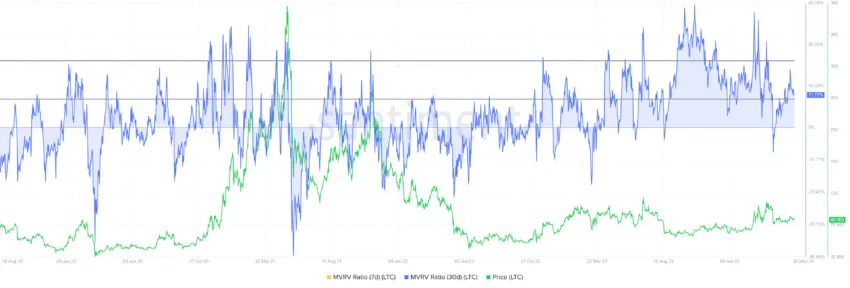
Litecoin’s price has been struggling to recover from the early April correction, as evidenced by the lack of profits recorded across the network. Since recovery will take a while, LTC holders seem to be looking to tap out before their losses rise.
This can be observed in the Market Value to Realized Value (MVRV) ratio, which evaluates investor profit or loss. Litecoin’s 30-day MVRV is currently at 11%, indicating profit and potentially leading to selling. Historically, LTC corrections happen when the MVRV is in the 10% to 24% range, known as the danger zone.
This is the case with Litecoin’s price as well.
Secondly, the change in the behavior of the investors is in line with the market sentiment, which is visible on the Relative Strength Index (RSI). The Relative Strength Index (RSI) is a momentum oscillator that measures the speed and change of price movements, ranging from 0 to 100. An RSI above 70 indicates overbought conditions, while an RSI below 30 indicates oversold conditions.
Read More: How To Buy Litecoin (LTC) and Everything You Need To Know
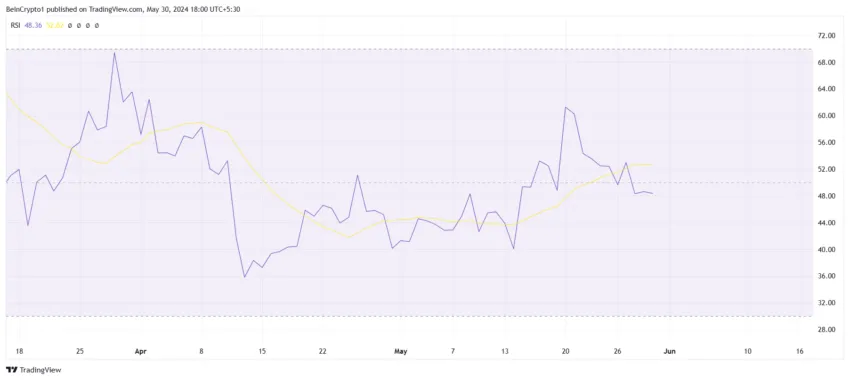
Although LTC is not overbought, it is still below the neutral line marked at 50.0. Cementing this line as a support floor is considered a bullish sign. But Litecoin might not be looking at this in the immediate future.
LTC Price Prediction: Staying Above $80
Litecoin’s price has been struggling to breach above $90, which would flip the 38.2% Fibonacci Retracement into support. But worse than this, LTC fell below the 23.6% Fib line.
This Fib level is known as the bear market support floor, and sustaining above it is considered a bullish sign. But a dip below it is a bearish signal. If Litecoin’s price follows this path, it could observe a drawdown to $80.
Read More: Litecoin (LTC) Price Prediction 2024/2025/2030
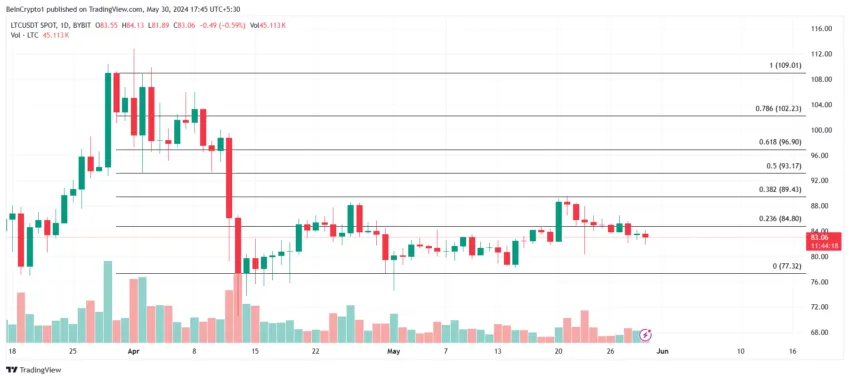
However, if the broader market cues change and Litecoin’s price turns bullish, it could reclaim the 23.6% Fib line as support. This might trigger recovery again, and a breach of $90 would invalidate the bearish thesis.
Disclaimer
In line with the Trust Project guidelines, this price analysis article is for informational purposes only and should not be considered financial or investment advice. BeInCrypto is committed to accurate, unbiased reporting, but market conditions are subject to change without notice. Always conduct your own research and consult with a professional before making any financial decisions. Please note that our Terms and Conditions, Privacy Policy, and Disclaimers have been updated.