
Jitalia17
Yields have surged in the last two months. That goes for both near-term rates and happenings on the long end of the yield curve. With inflation coming down but job growth remaining robust, there’s sufficient evidence for the Fed to continue hiking rates. What’s more, long-term rates are influenced by economic growth expectations, and if we side-step a recession, the long bond could fall and rates could rise. That has been the general mantra over the last several weeks. We will know more after CPI this week and as earnings season gets underway.
I am issuing a hold rating on the Vanguard Long-Term Treasury Index Fund (NASDAQ:VGLT). I like its low cost, high tradeability, and now a decent yield (particularly for long-term investors and tax-advantaged accounts), but time horizon is everything, and there are near-term downside risks along with some negative momentum trends.
Treasury Yield Rise Sharply From Early May, 30yr Tops 4%
Koyfin Charts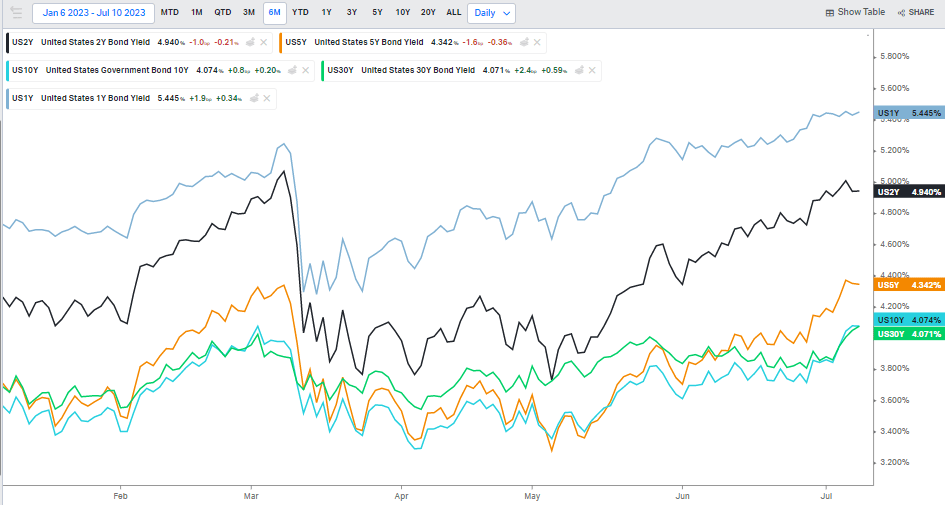
According to Vanguard, VGLT seeks to provide a high and sustainable level of current income by Investing primarily in U.S. Treasury bonds. The fund maintains a dollar-weighted average maturity of 10 to 25 years on the yield curve. VGLT is a very low-cost vehicle to access long-dated Treasury securities – its annual net expense ratio is just four basis points, and the current yield-to-maturity is 4.0%, about matching the rate on the 30-year Treasury bond.
So far this year, though, the fund is up just 1% total return due to the broad-based rate rise. A key difference today versus, say, late 2021 is that starting yields are much higher, so duration risk is not as high thanks to the effects of yield curve convexity.
Tradeability is strong with VGLT. The average volume on the ETF is more than 1.5 million shares over the last 25 trading days while the typical bid/ask spread is just two basis points. Volatility can be elevated, however. Over the last 52 weeks, VGLT has ranged 28%, per Vanguard.
Digging into the portfolio, VGLT is simple to understand. Its portfolio consists of 76 individual pieces of paper and net assets under management sum to $6.2 billion as of July 7, 2023. The ETF strictly owns long-term Treasuries, 41% of which are over 25 years in duration. There’s also a sizable chunk of exposure to the 15-to-25-year maturity range.
Thus, the portfolio plots on the upper right quadrant on the Morningstar fixed-income style box with a weighted average effective maturity of 16 years. That means, for example, that for every 1% parallel rise in the yield curve, all else equal, the VGLT share price would be expected to fall approximately 16%.
VGLT: Portfolio Profile and Characteristics
Morningstar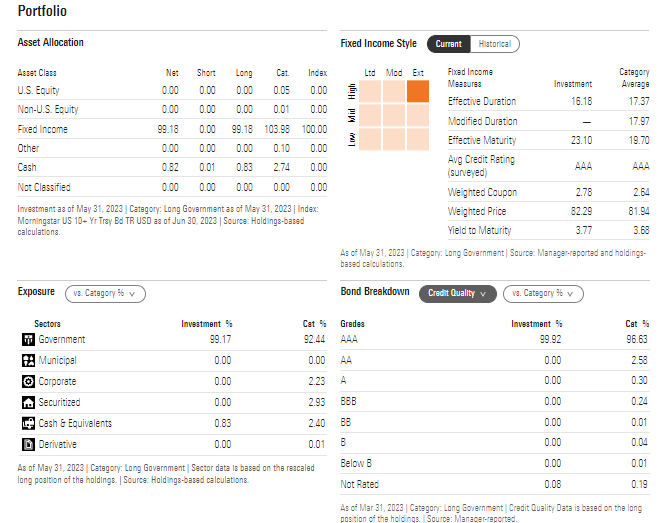
VGLT: Exposure To Often-Volatile Long-Dated Treasuries
Vanguard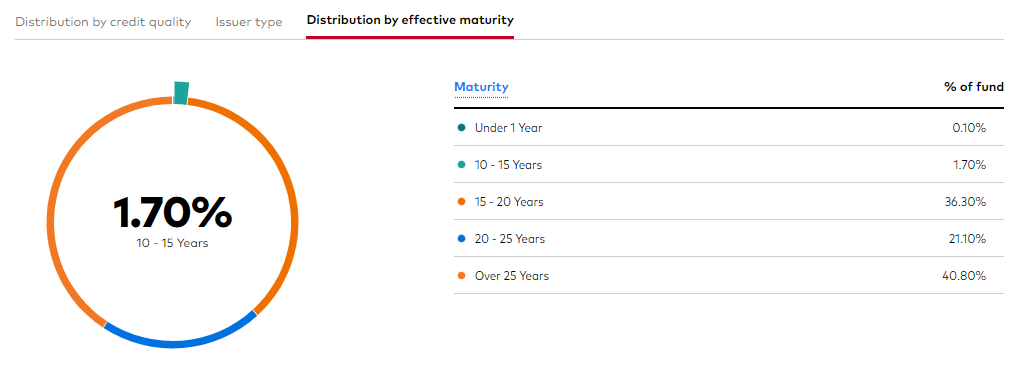
Seasonally, the long bond tends to perform well through August, according to data from Equity Clock. It is not uncommon to see volatility strike the stock market in Q3 of any given year, so a flight to quality and safety is the mantra that can benefit VGLT this time of year.
VGLT Seasonality: Bullish Trends Into Labor Day
Equity Clock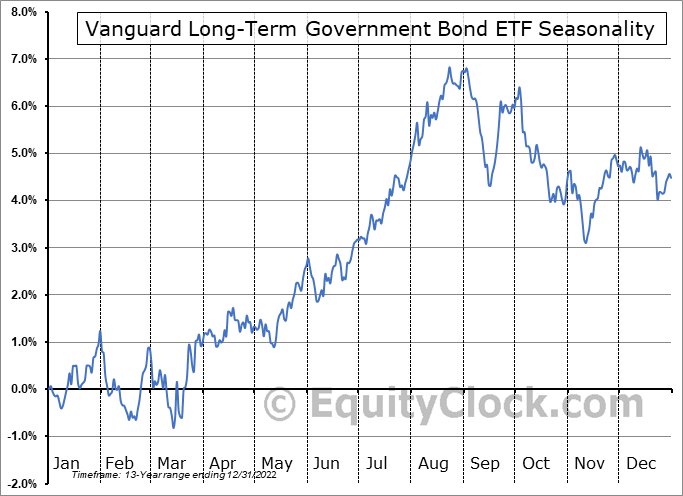
The Technical Take
The 30-year rate is back near 4%. We have been here before, and each of the previous two instances features dip buying on the long end of the Treasury curve. Notice in the chart below that VGLT has some support near or just above $61. That’s right where we trade today. Thus, I assert that if the ETF breaks under $60, then a retest of the October 2022 bottom is likely in the cards. For now, however, a trading range between $61 and $67 remains in play, so I have a hold rating, at least when it comes to the chart situation.
Even being long here with a tight stop under $60.50 could work since this is a highly liquid product. Concerning is the volume profile so far this month – there are some big red volume bars indicating significant selling pressure which could lead to higher downside momentum. Moreover, with both the long-term 200-day moving average and nearer-term 50-day moving average downwardly sloped, the bears are broadly in control. Finally, the RSI momentum indicator at the top of the chart could be the most important indicator to monitor – if the line falls under 30, that may portend a move down in price.
VGLT: Trading Range Threatened, Big Bearish Volume In July, Precarious RSI
Stockcharts.com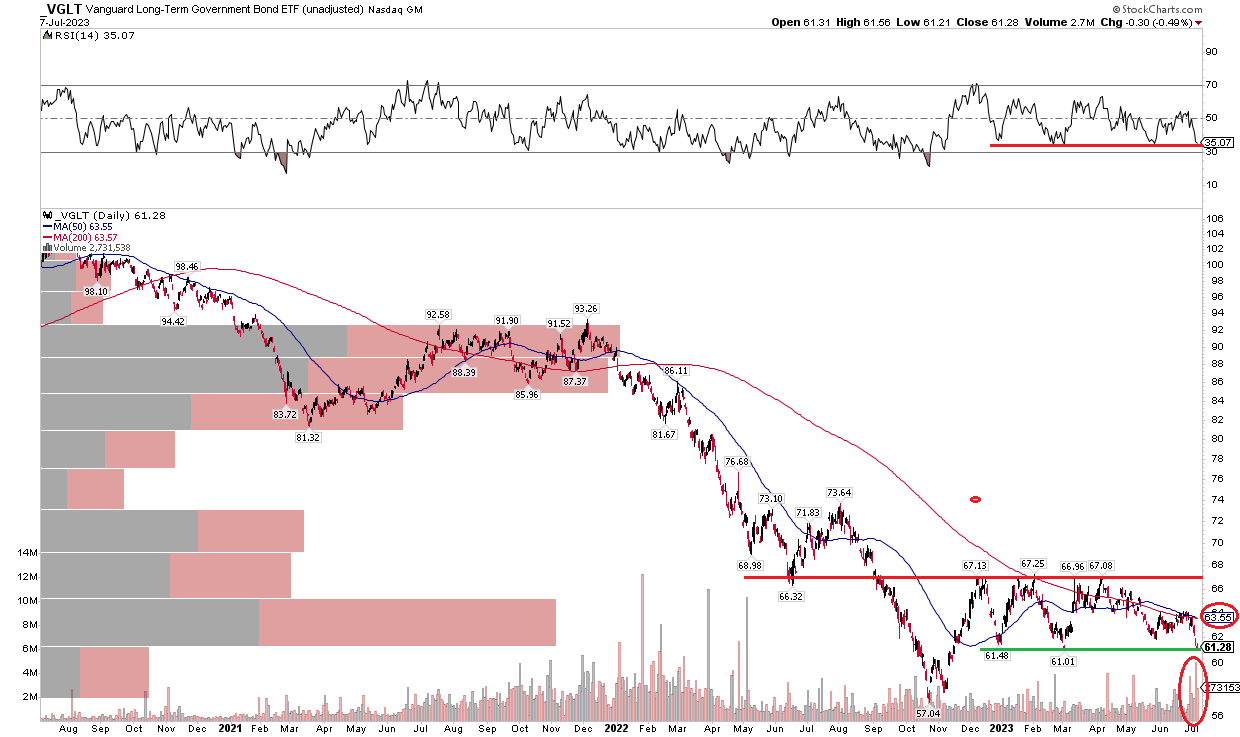
The Bottom Line
I am a hold on VGLT. I believe it to be a solid long-term holding for investors looking to diversify their portfolios due to its high liquidity and low cost (particularly attractive for tax-qualified accounts), but the near-term technical outlook and momentum situation suggests downside risks.
Read More: VGLT: Long Bonds Near Key Support, ETF A Hold Ahead Of Key Data