
angel_nt
A guest post by Ovi
Below are a number of Crude plus Condensate (C + C) production charts, usually shortened to “oil”, for oil-producing countries. The charts are created from data provided by the EIA’s International Energy Statistics and are updated to September 2023. This is the latest and most detailed/complete World Oil production information available. Information from other sources such as OPEC, the STEO, and country-specific sites such as Russia, Brazil, Norway, and China are used to provide a short-term outlook for future output and direction for a few of these countries and the World.
World Oil Production and Projection
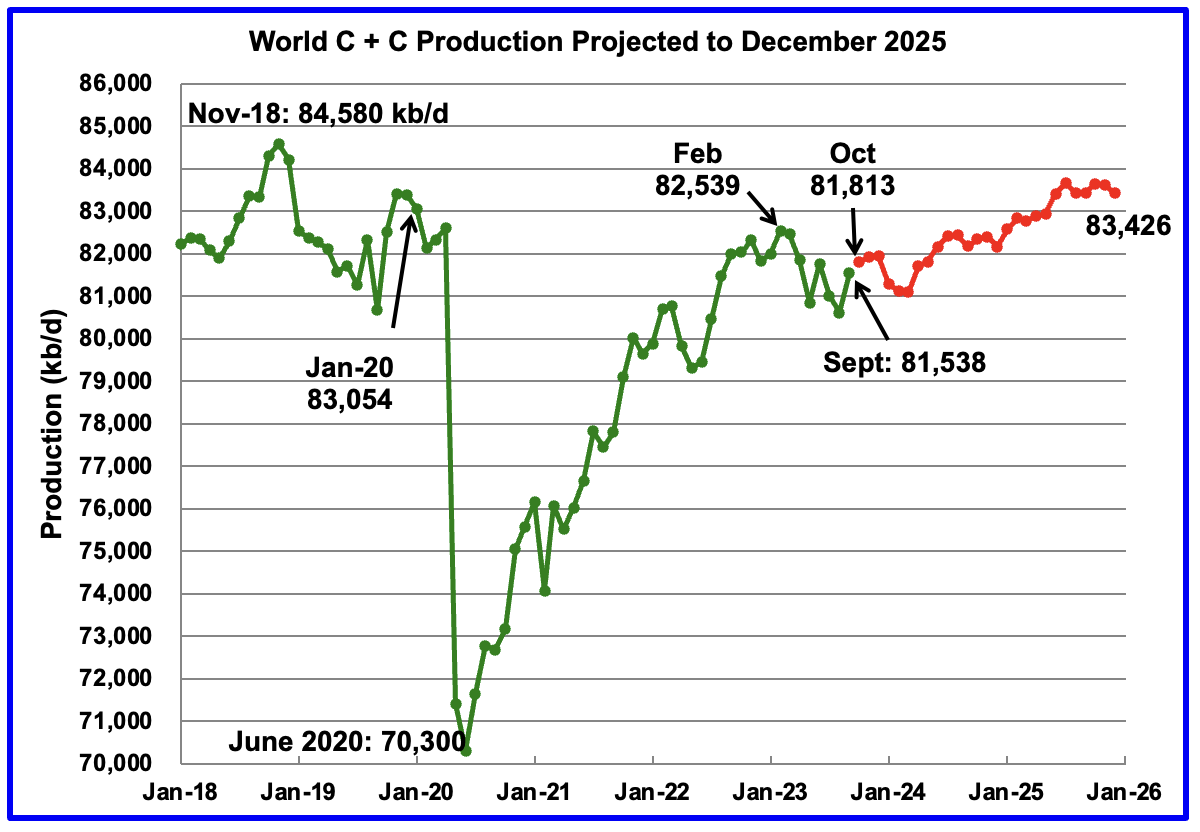
World oil production increased by 927 kb/d in September, green graph. The largest increase came from Saudi Arabia, 500 kb/d, while the US added 224 kb/d and Brazil 210 kb/d.
This chart also projects World C + C production out to December 2025. It uses the January 2024 STEO report along with the International Energy Statistics to make the projection. (Red markers).
The red graph forecasts that World crude production in December 2025 will be 83,426 kb/d and is 1,154 kb/d lower than the November 2018 peak. Note the large production decrease starting in January 2024. It could be reflecting the latest OPEC+ cut announced in November 2023.
From October 2023 to December 2025, production is estimated to increase by 1,613 kb/d or an average of 62 kb/d/mth.
Keep in mind that OPEC+ has close to 3,000 kb/d of cuts in reserve if required.
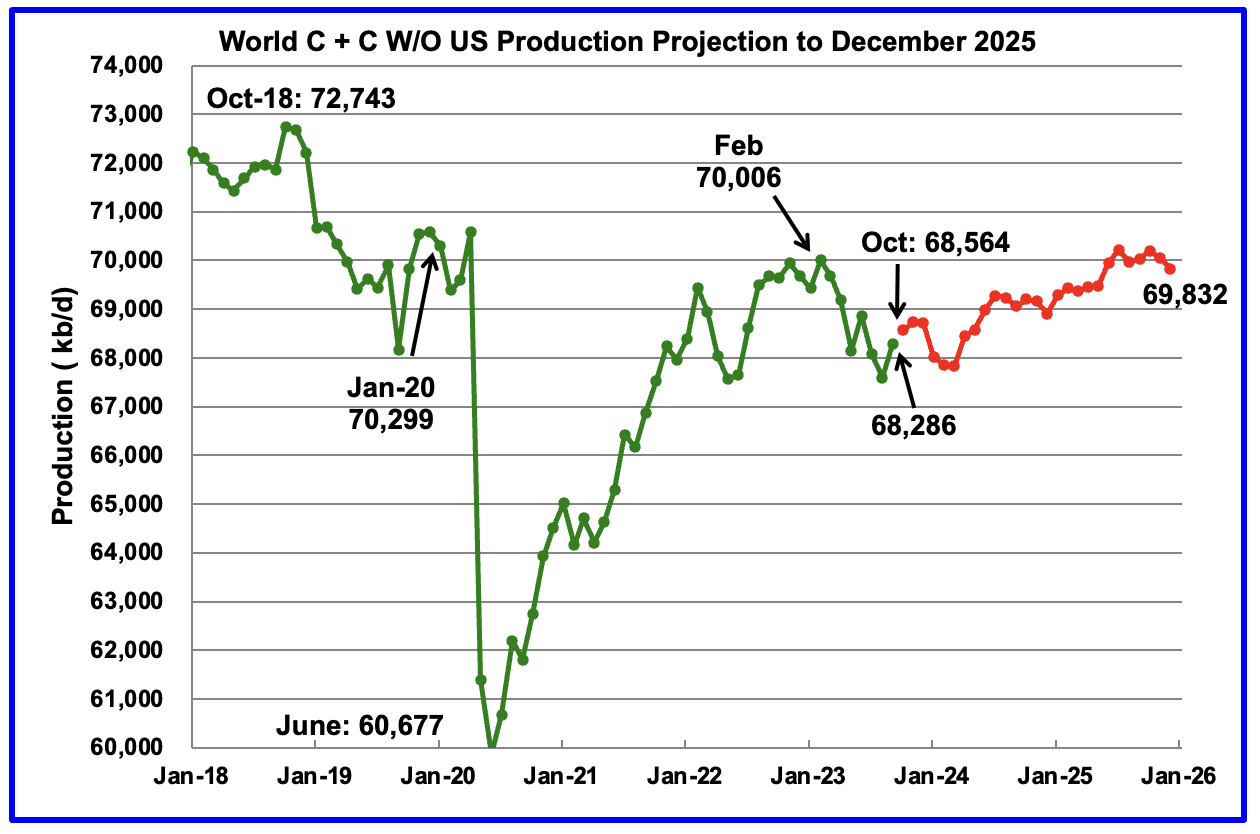
World without the US oil output in September increased by 688 kb/d to 68,286 kb/d. October is expected to add 378 kb/d.
Note that December 2025 output of 69,832 kb/d is lower than February 2023.
World oil production W/O the U.S. from October 2023 to December 2025 is forecast to increase by a total of 1,268 kb/d.
A Different Perspective on World Oil Production
Instead of dividing the World oil-producing countries into OPEC and Non-OPEC, this section divides the countries into two groups on the basis of their production capacity. The division will be The Big Three, US, Saudi Arabia and Russia, and the Rest, i.e., the World oil producers W/O the Big 3. The top producer in the Rest, currently Canada, produces less than half of the lowest producer in the Big Three.
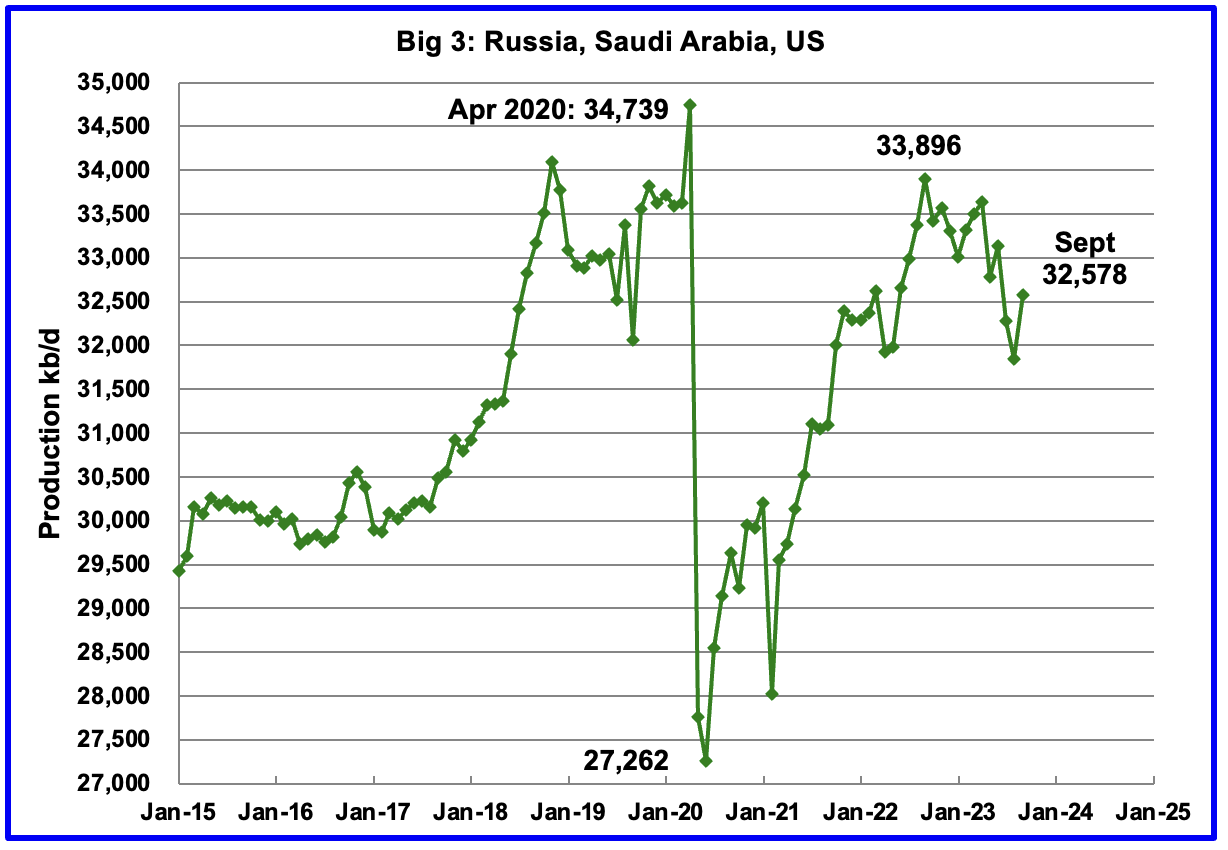
Peak production in the Big 3 occurred in April 2020 with a rate of 34,739 kb/d. The peak was associated with a large production increase from Saudi Arabia. Post-COVID, production peaked at 33,896 kb/d in September 2022. The production drop since then is due to cutbacks within the OPEC+ countries.
September production from the Big 3 increased by 730 kb/d to 32,578 kb/d.
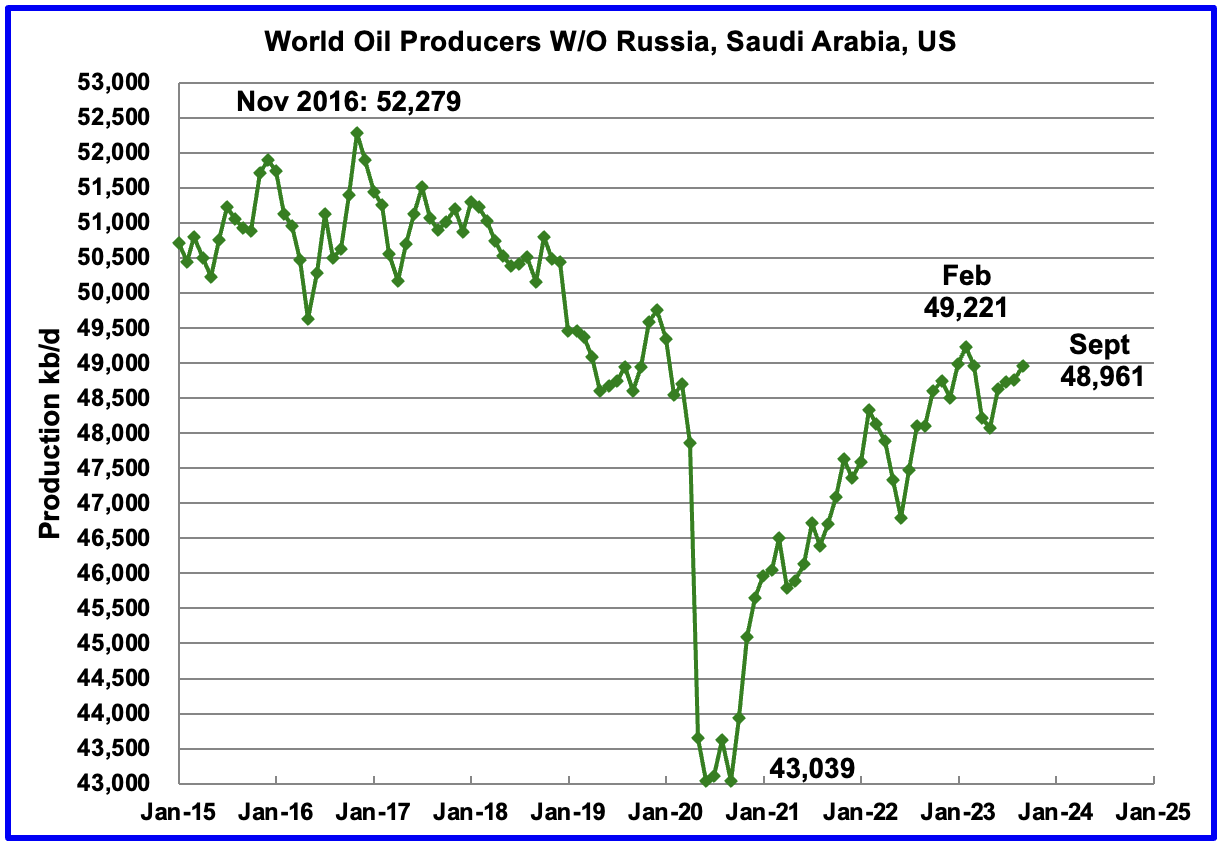
Production in the Rest has been slowly increasing since the low of September 2020, 43,039 kb/d. In February 2023, production rose to a post-COVID high of 49,221 kb/d. Output in September was 48,961 kb/d, an increase of 235 kb/d over August.
Production is down 3,318 kb/d from November 2016.
World Oil Production Ranked by Country
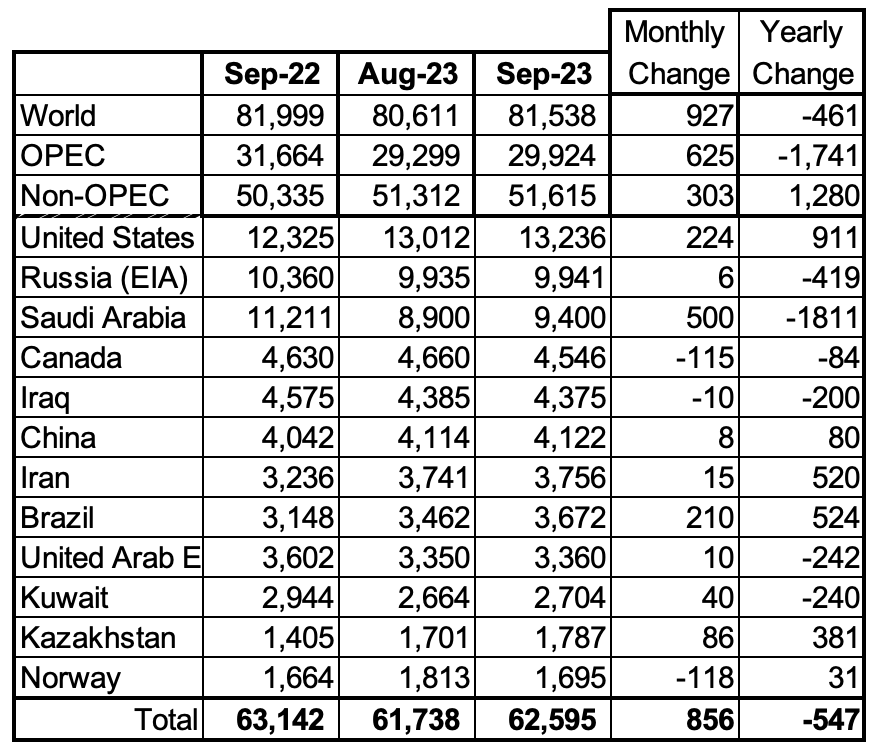
Above are listed the World’s 12th largest oil producers. In September 2023, these 12 countries produced 76.8% of the world’s oil. On a MoM basis, these 12 countries increased production by 856 kb/d, while on a YOY basis, production dropped by 547 kb/d. On a YoY basis, the size of the Saudi Arabia drop is double the US increase.
Non-OPEC Oil Production Charts
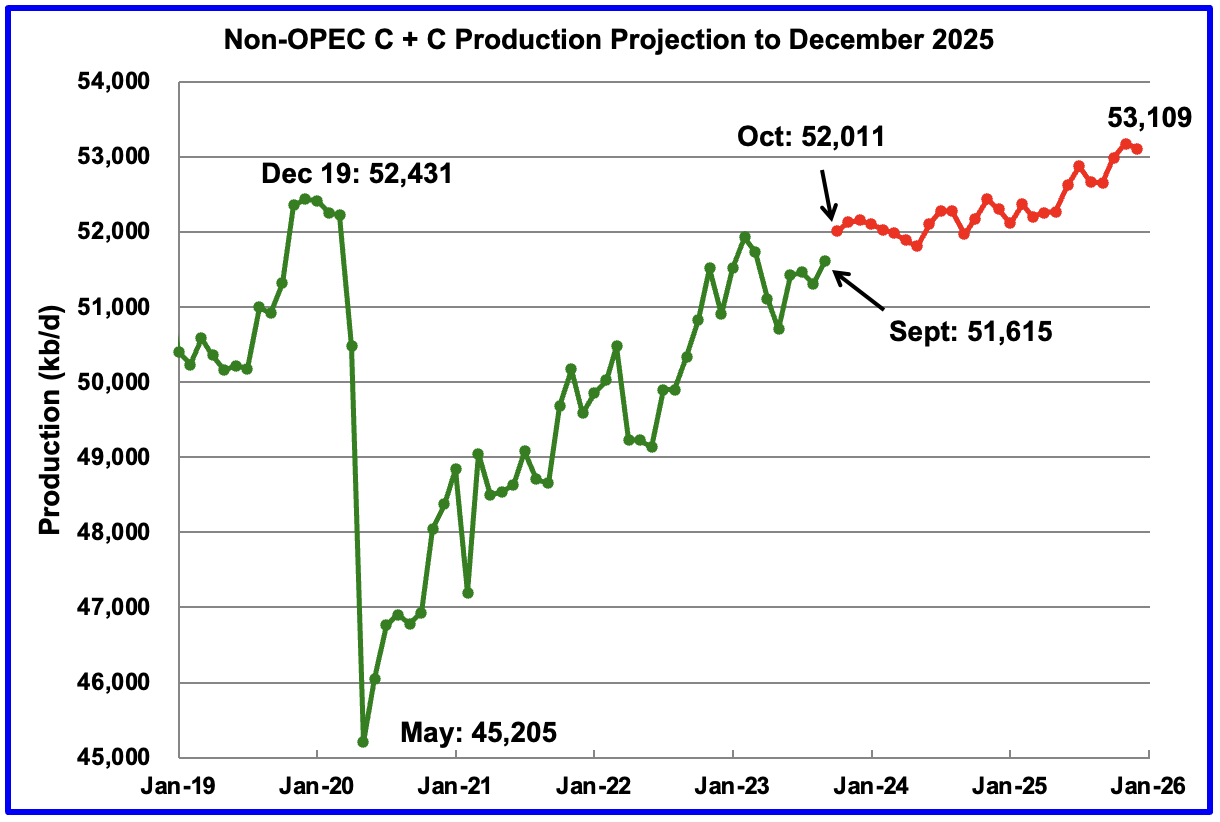
September Non-OPEC oil production rose by 303 kb/d to 51,615 kb/d. The largest increase came from the US.
Using data from the December 2023 STEO, a projection for Non-OPEC oil output was made for the period October 2023 to December 2025. (Red graph). Output is expected to reach 53,109 kb/d in December 2025, which is 678 kb/d higher than the December 2019 peak of 52,431 kb/d.
From October 2023 to December 2025, oil production in Non-OPEC countries is expected to increase by 1,098 kb/d. According to the STEO, the major contributors to the increase are expected to be the US and Canada.
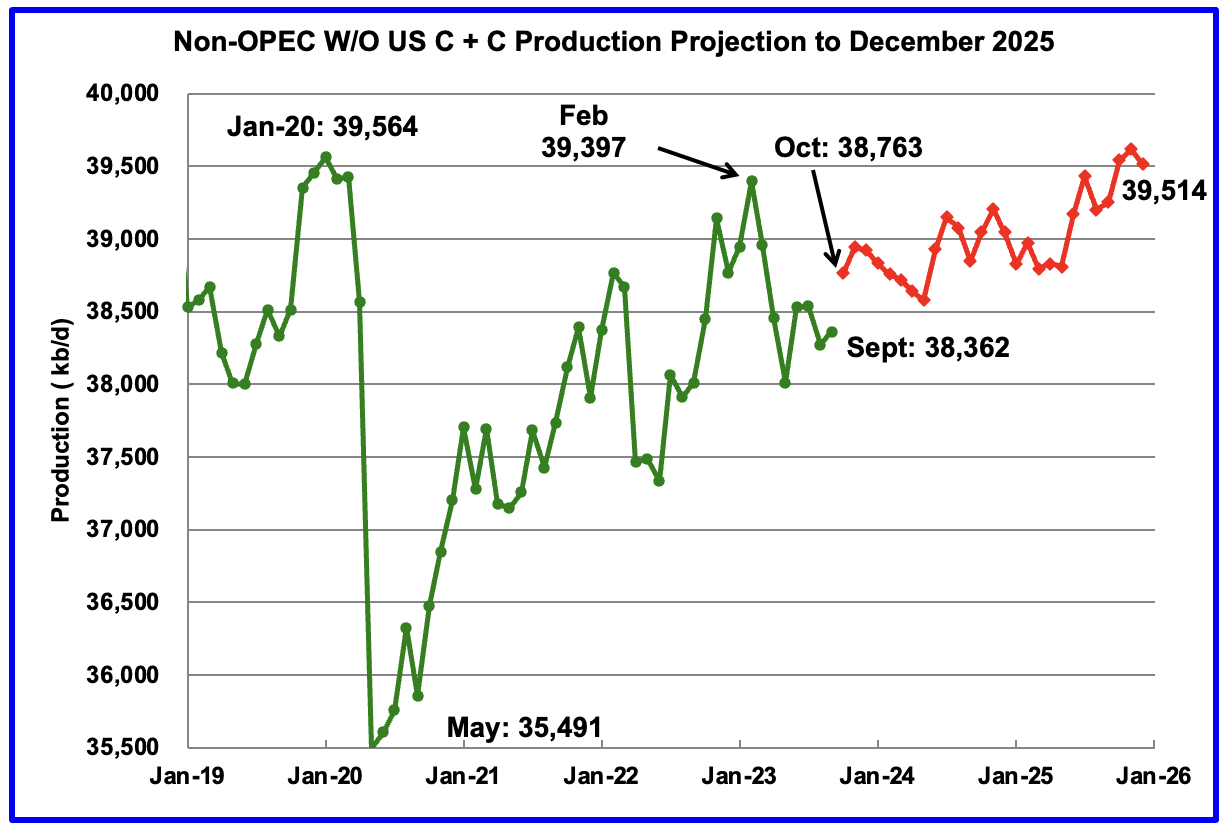
September Non-OPEC W/O US production increased by 91 kb/d to 38,362 kb/d. October production is projected to increase by 401 kb/d.
From October 2023 to December 2025, production in Non-OPEC countries W/O the US is expected to increase by 751 kb/d.
Note that the December 2025 output is lower than the January 2020 high of 39,564 kb/d by 50 kb/d.
Non-OPEC Oil Production Ranked by Country
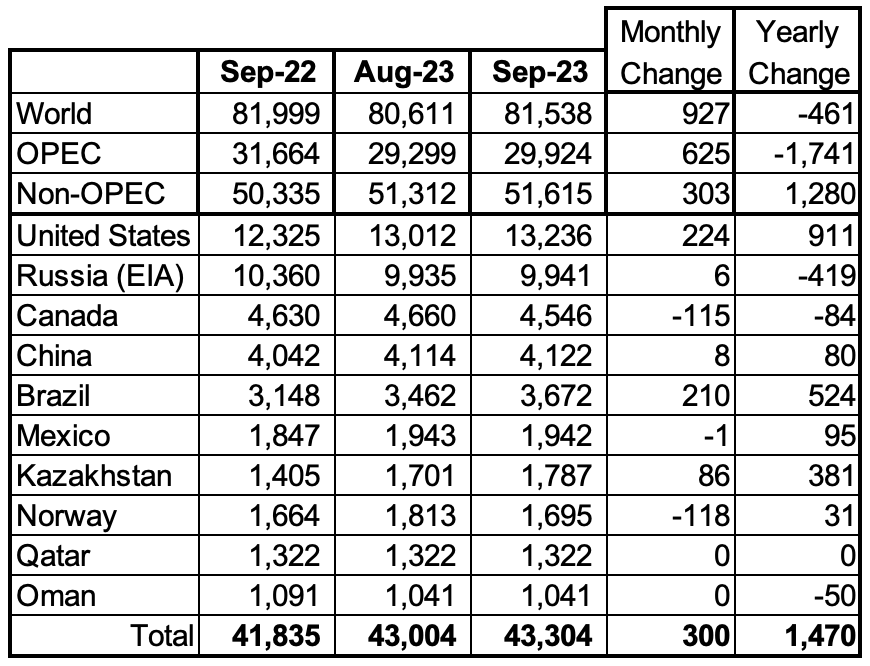
Listed above are the World’s 10 largest Non-OPEC producers. The criteria for inclusion in the table is that all of the countries produce more than 1,000 kb/d.
September’s production increase for these ten Non-OPEC countries was 300 kb/d while as a whole, these Non-OPEC countries saw a production increase of 303 kb/d.
In September 2023, these 10 countries produced 83.9% of all Non-OPEC oil production.
OPEC’s C + C production increased by 625 kb/d MoM, while…
Read More: September World Oil Production Rebounds