
Natural gas has been trading on the CME’s NYMEX division for three decades, since 1990. The range over the period has been from $1.02 to $15.65 per MMBtu. The low came in 1992 and the high in 2005. In June 2020, natural gas fell to a quarter-of-a-century low at $1.432. The price fell to a level that was only 41.2 cents above the record low. While the bearish price action in the natural gas market was significant, another energy commodity, crude oil, reached a record low below zero in April 2020.
At below the $3 per MMBtu level, the natural gas futures market remains a lot closer to the thirty-year low than the high. The last time natural gas traded at over $6.50 per MMBtu was a dozen years ago in 2008. We are now moving into the peak season for demand starts in November each year. 2020 is a unique year in many ways, but in the natural gas market, the 2020/2021 withdrawal season arrives at the same time as the US election. The contest will determine the future of US oil and gas production, which could have significant ramifications for prices.
Meanwhile, natural gas fell to a twenty-five-year low in June and rose to the highest price since early 2019 over the past week. We should expect increased volatility in the energy commodity over the coming weeks as the market faces bullish and bearish influences. The ProShares Ultra Bloomberg Natural Gas Product (BOIL) and its bearish counterpart (KOLD) offer market participants leverage compared to the NYMEX natural gas futures market.
Hurricane Delta prompted buying
Hurricane Delta hit the states along the Gulf of Mexico at just about the same point Hurricane Laura made landfall one month before. The delivery point for NYMEX natural gas futures is at the Henry Hub in Erath, Louisiana, not far from the Gulf of Mexico and the paths of the recent storms. The record highs above $10 per MMBtu in natural gas in 2005 and 2008 came as Hurricanes Katrina and Rita ravaged the home to natural gas infrastructure.
Meanwhile, after making a quarter-of-a-century low of $1.432 per MMBtu in late June, the natural gas price was already on the rebound when the latest storms arrive. Just days after the low in June, value investor Warren Buffett announced that his Berkshire Hathaway acquired the transmission and pipeline assets of Dominion Energy (NYSE:D) for a bargain-basement price of $10 billion in cash and assumed debt. The news lifted the price of the energy commodity above the $2 level by early August. The storms caused two rounds of buying that took the price to higher highs in late August and early October.
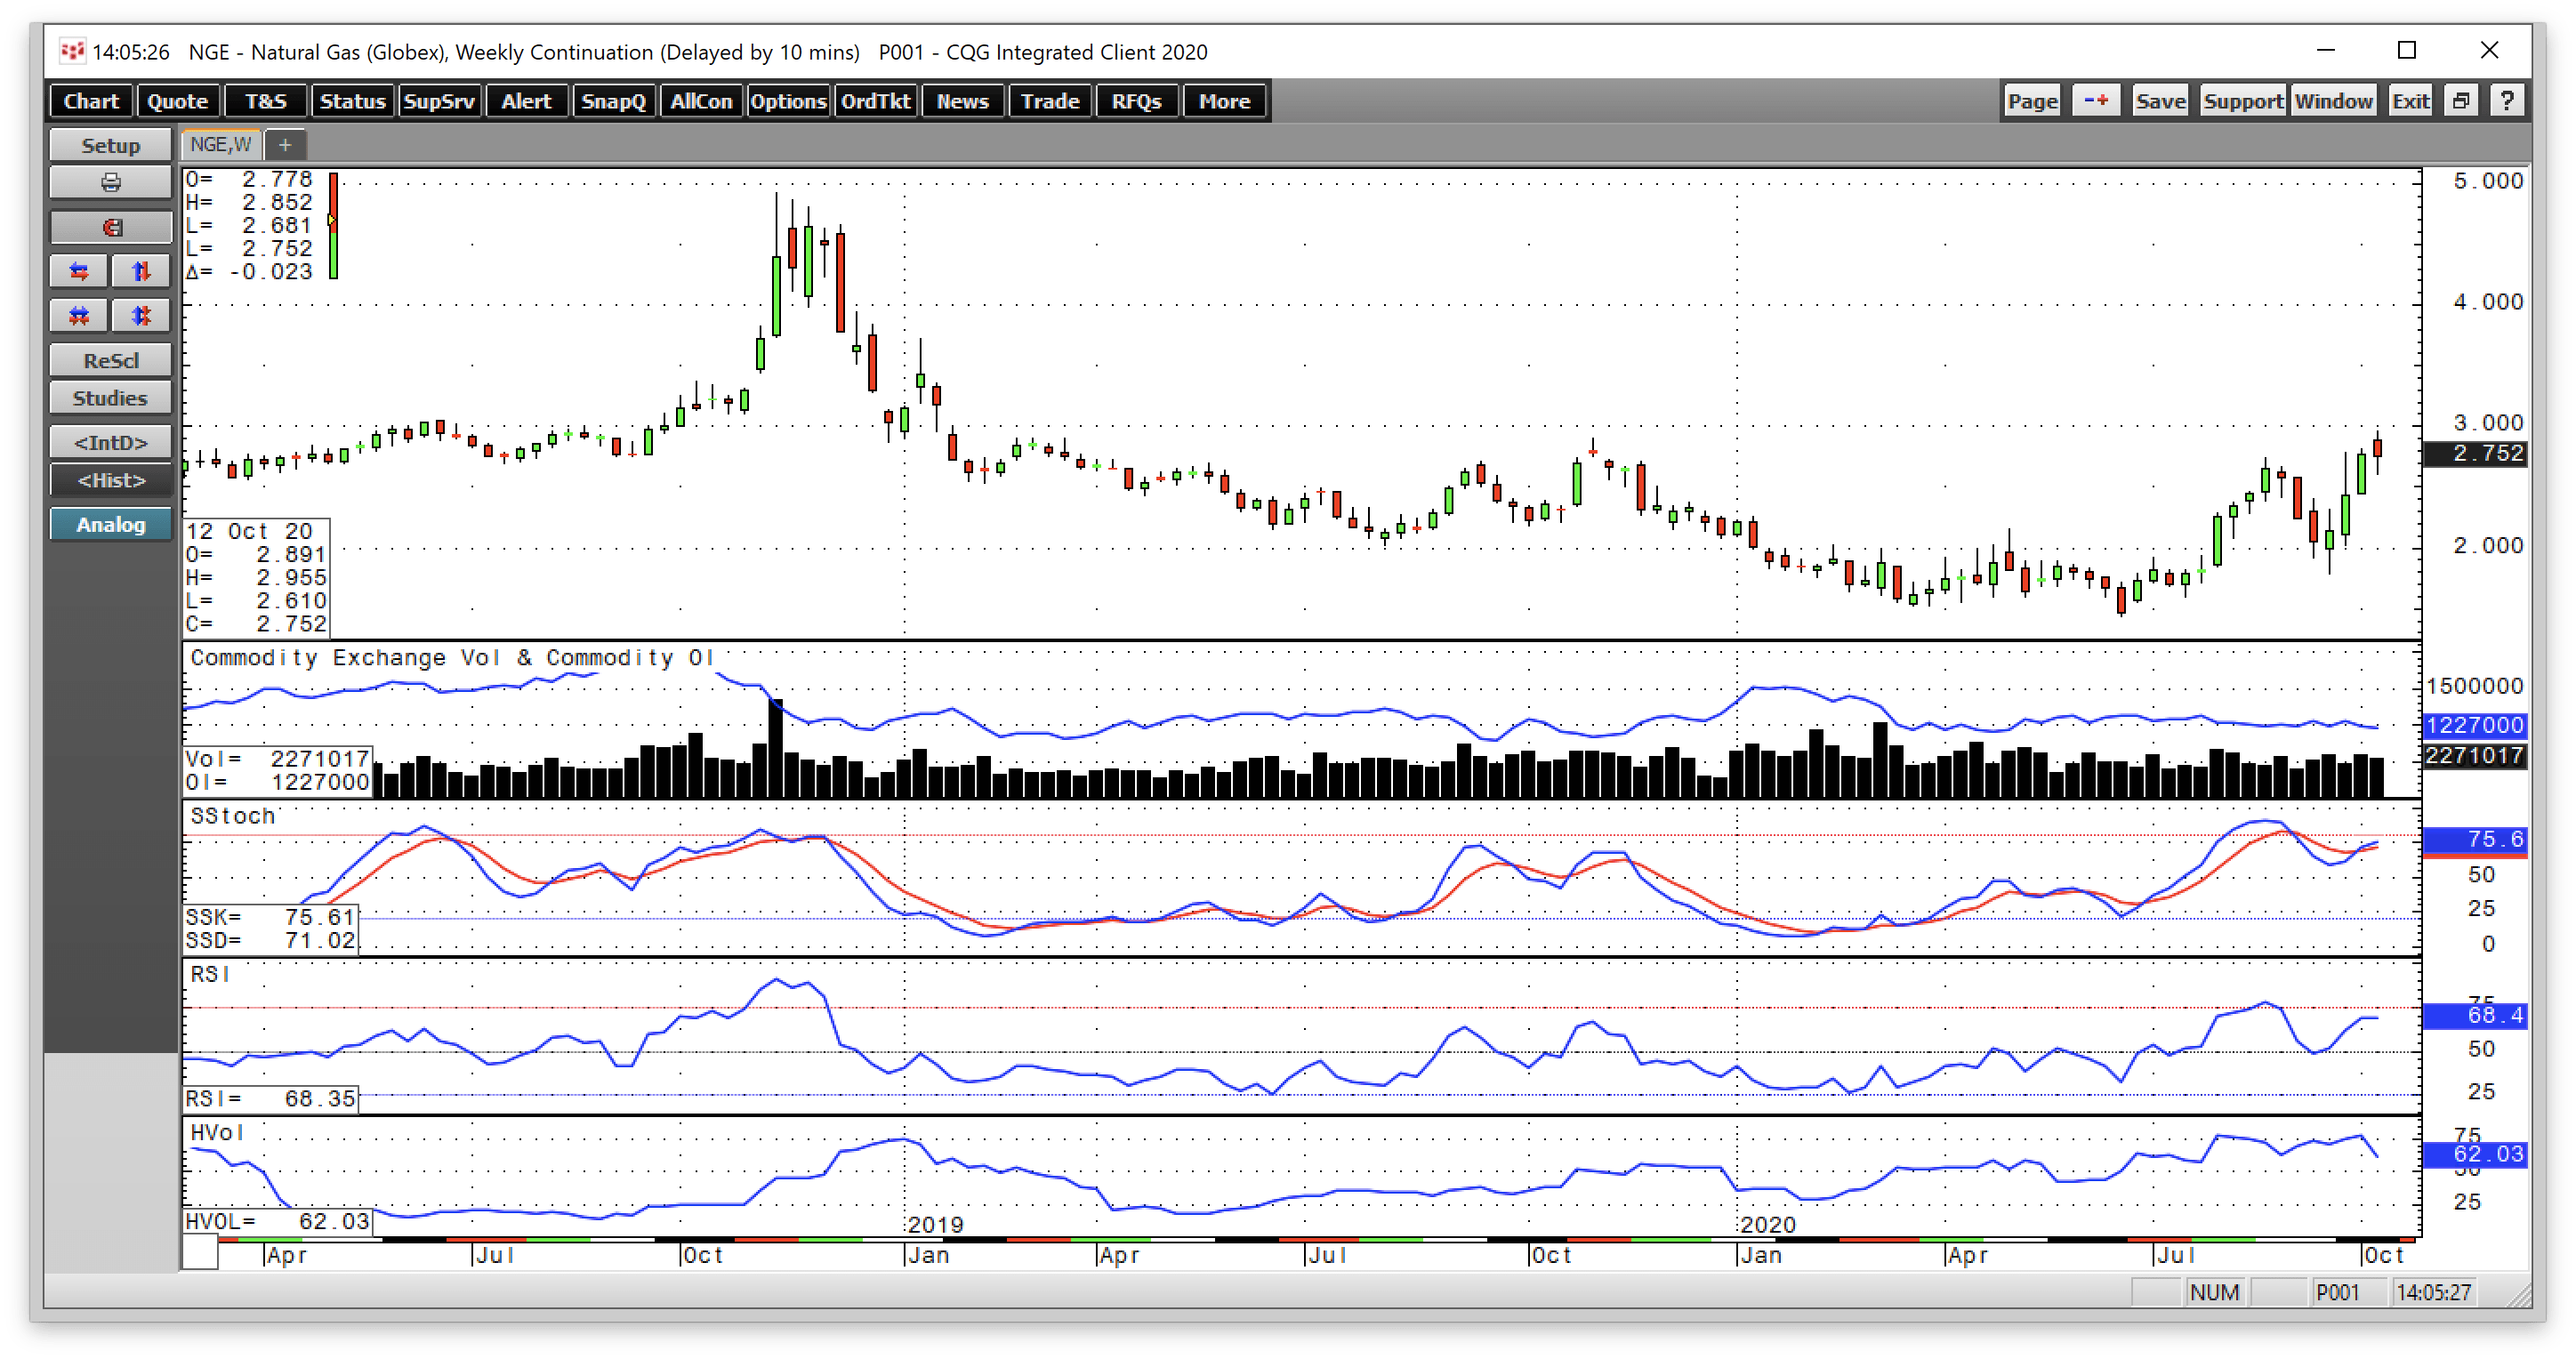
Source: CQG
As the weekly chart highlights, natural gas rose to $2.743 on the back of Hurricane Laura during the week of August 24. Hurricane Delta sent nearby natural gas futures to $2.955 per MMBtu last week as the price surpassed the November 2019 high and level of technical resistance at $2.905.
In the aftermath of the latest storm, the price backed off to below the $2.80 level as of October 16. The total number of open long and short positions in the natural gas futures market has not moved all that much over the past months. After reaching a peak of over 1.51 million contracts in January 2020, the metric dropped to a low for the year at just below the 1.2 million contract level. At 1.227 million contracts, the metric remains near the lows for the year and has been edging lower as the price recovered. Falling open interest and rising price is not typically a technical validation of a bullish trend in a futures market. Weekly price momentum and relative strength indicators were above neutral readings on October 16. Weekly historical volatility at almost 62% remains at an elevated level, given the wide price ranges since June’s twenty-five year low. The hurricanes prompted buying over the past two months as Warren Buffett’s vote of confidence in the market that had declined to a historically inexpensive level.
The latest EIA data continues to be a warning sign
After rising to the highest price since January 2019, the Energy Information Administration released its latest inventory data for the week ending October 9 on Thursday, October 15.
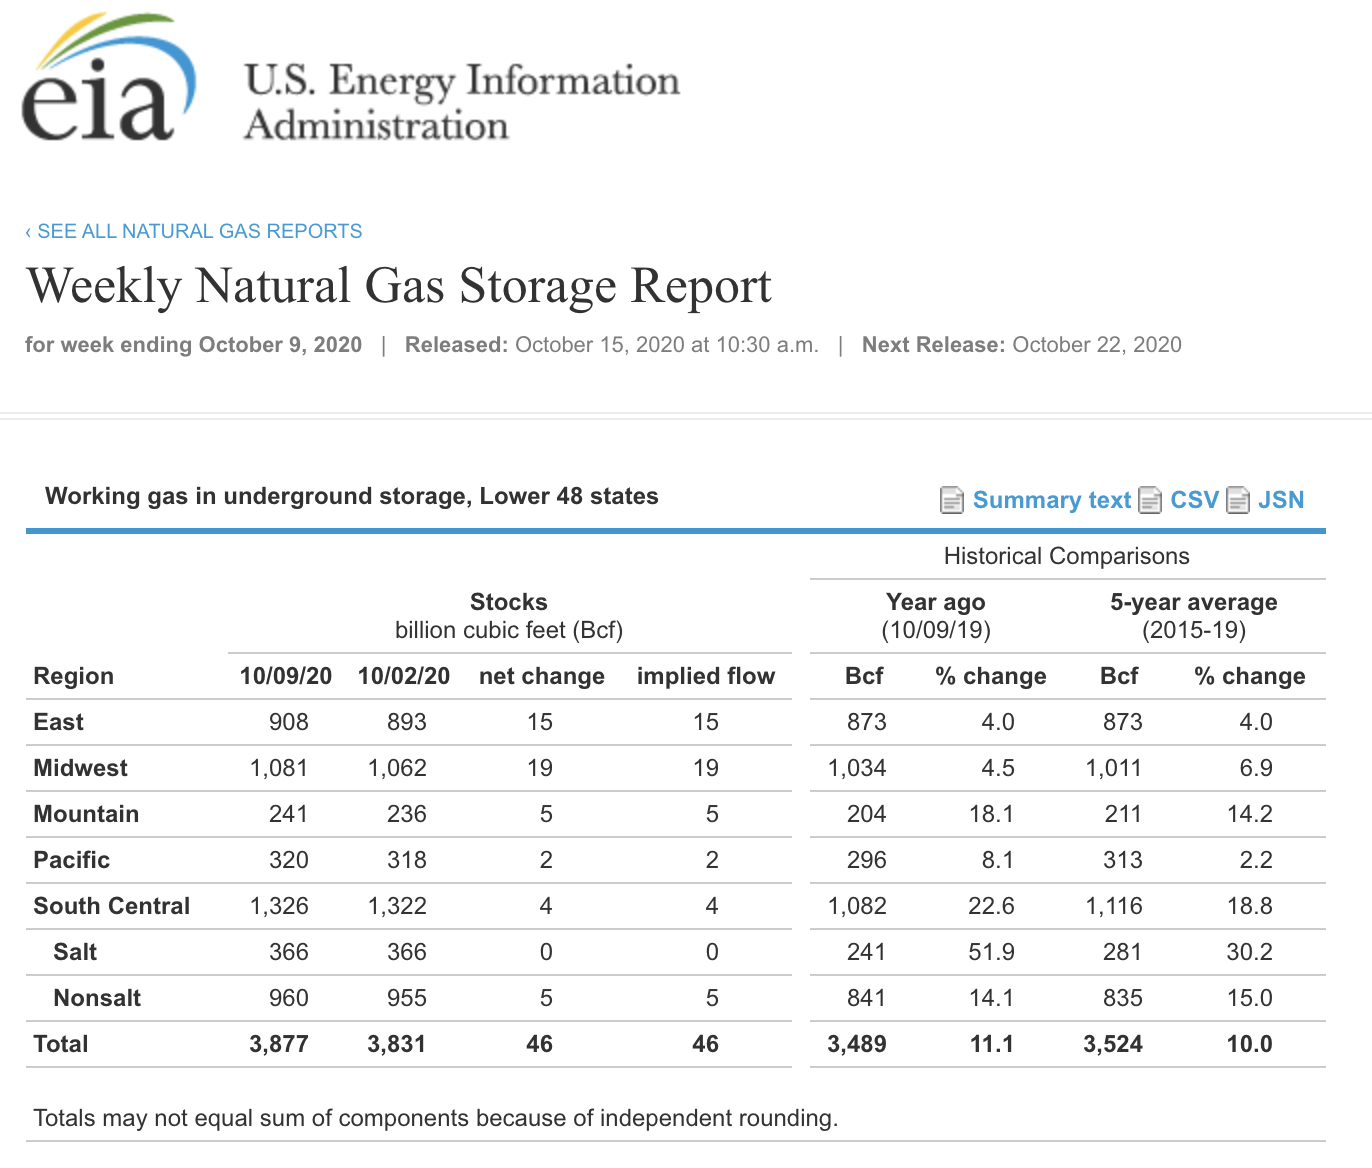
Source: CQG
As the chart illustrates, stockpiles rose by 46 billion cubic feet, pushing the total amount of natural gas in storage across the United States to 3.877 trillion cubic feet. With approximately five weeks to go before the beginning of the peak season for demand when stocks begin to decline, the inventory level is already substantially above the high from November 2019 at 3.732 tcf. Stocks were 11.1% above last year’s level and 10% over the five-year average for October 9 as of the end of last week.
A new record higher in stockpiles is on the horizon
The record level of stocks going into the winter months was at…
Read More: Natural Gas Makes A New High (NYSEARCA:BOIL)