
- Litecoin started a fresh decline from the $78.00 resistance zone against the US Dollar.
- LTC price is now trading below $70.00 and the 55 simple moving average (4 hours).
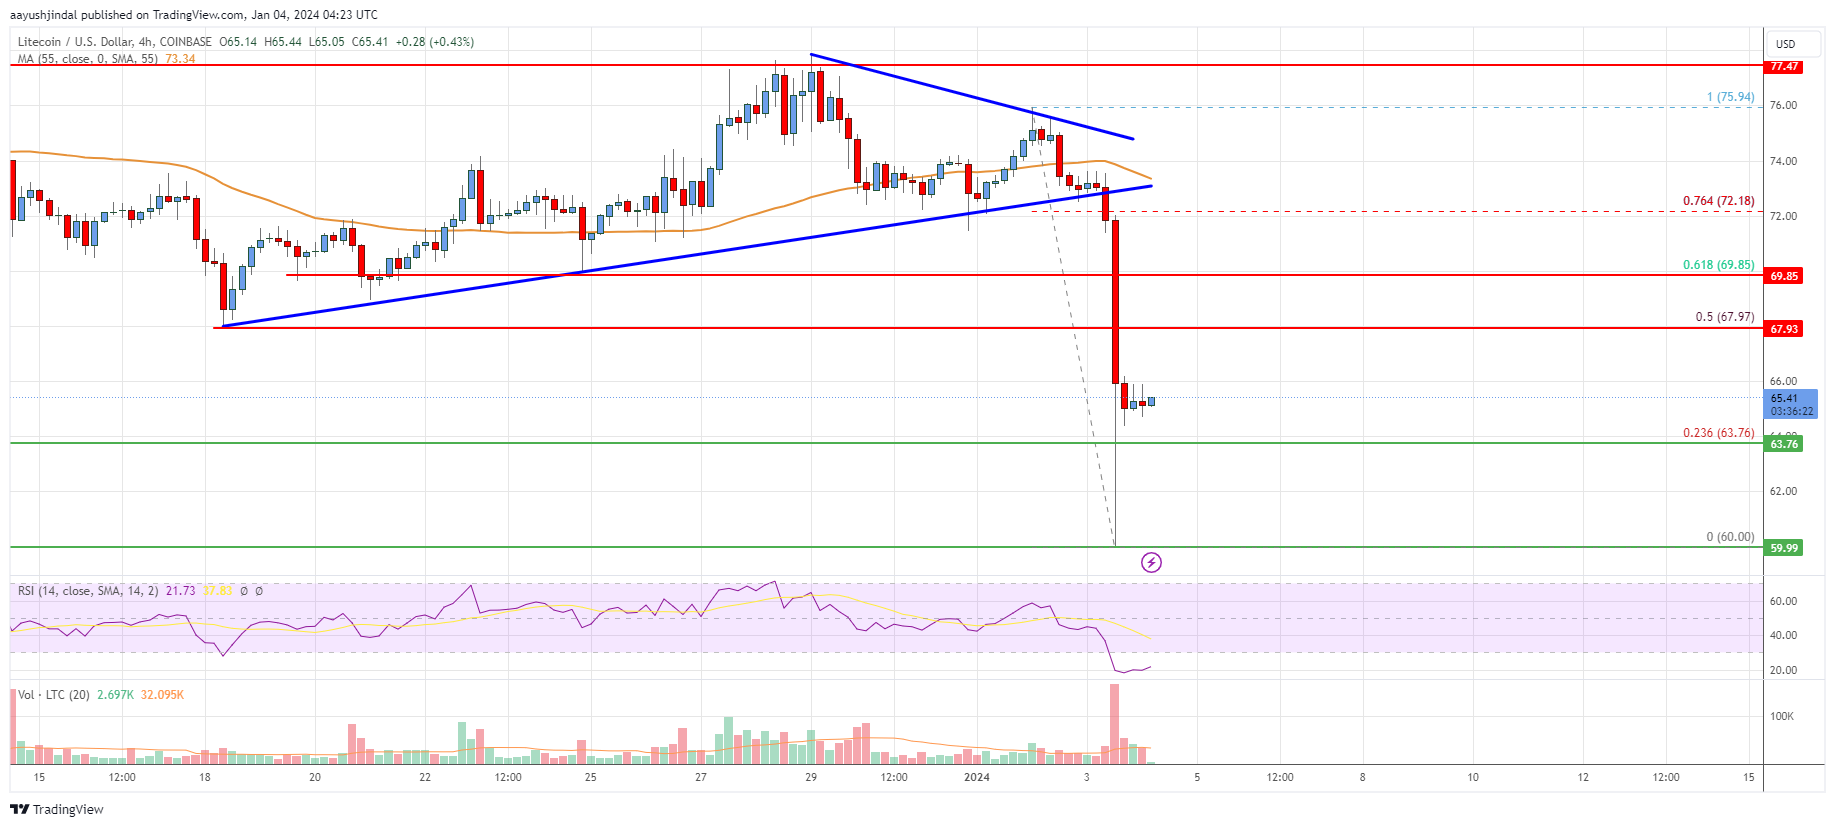
- There was a break below a key contracting triangle with support at $72.50 on the 4-hour chart of the LTC/USD pair (data feed from Coinbase).
- The pair could continue to move down unless the bulls protect the $60.00 support zone.
Litecoin price is struggling below $70.00 against the US Dollar, like Bitcoin. LTC price could continue to decline if it stays below the $70.00 resistance zone.
Litecoin Price Analysis
In the past few sessions, there was a sharp decline in Bitcoin, Ethereum, Ripple, and Litecoin against the US Dollar. Earlier, LTC struggled to clear the $78.00 resistance and started a fresh decline.
The price broke the $72.50 support zone to enter a bearish zone. There was a break below a key contracting triangle with support at $72.50 on the 4-hour chart of the LTC/USD pair. The pair even spiked below the $63.75 support and tested the $60.00 zone.
A low has formed near $60.00, and the price is now consolidating losses. It is now trading below $70.00 and the 55 simple moving average (4 hours). Immediate resistance is near the $68.00 level. It is close to the 50% Fib retracement level of the downward move from the $75.94 swing high to the $60.00 low.
The next major resistance is near the $70.00 level or the 61.8% Fib retracement level of the downward move from the $75.94 swing high to the $60.00 low.
A clear move above the $70.00 level could pump the price toward the $78.00 level. The next major resistance could be $80. On the downside, immediate support is near the $63.75 level.
The next key support is near the $60.00 level. If there is a downside break below the $60.00 support, the price could accelerate lower toward the $55.00 level in the near term.
Looking at the chart, Litecoin price is clearly trading below $70.00 and the 55 simple moving average (4 hours). Overall, the price could continue to move down if it stays below the $70.00 resistance zone.
Technical indicators
4 hours MACD – The MACD for LTC/USD is now gaining pace in the bearish zone.
4 hours RSI (Relative Strength Index) – The RSI for LTC/USD is now below the 50 level.
Key Support Levels – $63.75 and $60.00.
Key Resistance Levels – $68.00 and $70.00.
Read More: Litecoin (LTC) Price Analysis: Can Bulls Protect This Uptrend Support