Gold Market Analysis: Navigating Volatility Amidst Economic Data, Geopolitical
manassanant pamai
Fundamentals
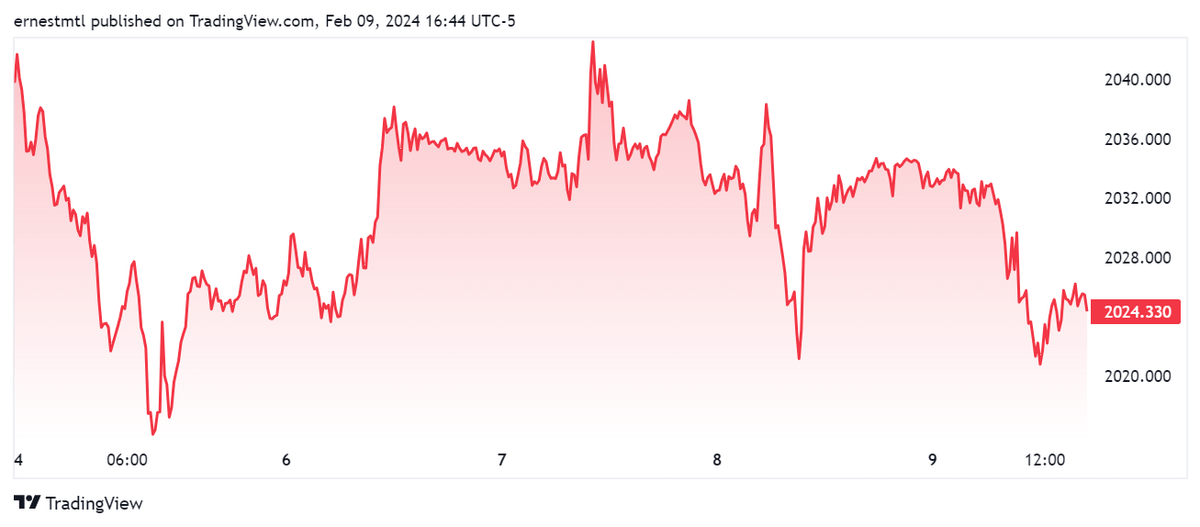
The gold market experienced significant fluctuations at the beginning of the week, with spot prices starting above $2,041 per ounce before dropping to a low of $2,016 by Monday morning. Throughout the week, gold prices mainly traded within this range, reaching a high of $2,042.53 on Wednesday morning and testing support near the $2,021 level multiple times. Despite this volatility, sentiment towards gold remained cautiously optimistic.
GOLD (TRADING VIEW)
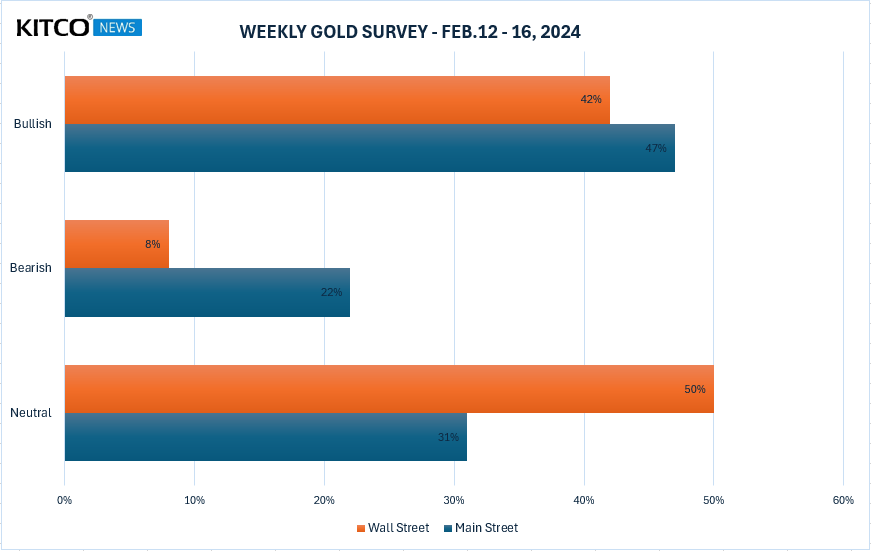
The latest Kitco News Weekly Gold Survey indicated a consensus forecast of steady prices with a chance for gains in the upcoming week. Analysts and investors expressed varying opinions regarding the factors influencing gold’s direction, including inflation data, geopolitical developments, and U.S. economic indicators.
SURVEY (KITCO)
Adrian Day of Adrian Day Asset Management viewed gold’s sideways movement positively, suggesting that it could find a base and move upward after a recent pullback. Similarly, James Stanley from Forex.com remained bullish, citing the resilience of gold despite a rally in the U.S. Dollar.
Bob Haberkorn of RJO Futures highlighted market reactions to Chinese data and rising equities as factors affecting gold prices. He emphasized the importance of upcoming U.S. inflation data in determining gold’s near-term direction.
Analysts and experts expressed mixed sentiments regarding gold’s short-term outlook, with some anticipating a breakout from the current sideways trend while others expected continued consolidation. Geopolitical events, such as developments related to former President Donald Trump’s Supreme Court case, were also considered potential catalysts for market movements.
Despite differing opinions, most analysts agreed that gold prices would likely remain within their recent range until significant new market developments occur. As of the latest update, spot gold was trading slightly higher but remained down for the week.
Let’s examine the weekly standard deviation report published in Market Place and see what short-term trading opportunities we can identify for the week.
GOLD: Weekly Standard Deviation Report
Feb. 10, 2024 10:16 AM ET
Summary
- Gold futures contract closed below the 9-day SMA, confirming a bearish weekly trend momentum.
- The Market closed below the VC Weekly Price Momentum Indicator, confirming bearish price momentum.
- Consider taking profits on short positions at the 2026-2014 levels, and look for potential reversal points for long positions.
-
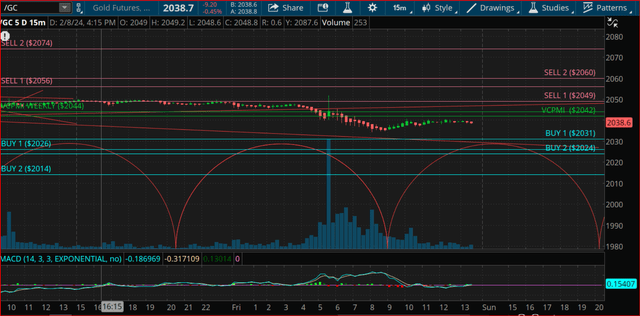
Weekly Trend Momentum: The gold futures contract closed at 2039, below the 9-day Simple Moving Average (SMA) of 2062, confirming a bearish weekly trend momentum. A close above the 9-day SMA would neutralize the bearish short-term trend to neutral.
-
Weekly Price Momentum: The market closed below the VC Weekly Price Momentum Indicator at 2044, confirming bearish price momentum. A close above this indicator would neutralize the bearish short-term trend to neutral.
-
Weekly Price Indicator: For short positions, consider taking profits on corrections at the 2026-2014 levels and consider going long on a weekly reversal stop. If long, utilize the 2014 level as a Monthly Stop Close Only and Good Till Cancelled order. Look to take profits on long positions as the market reaches the 2056-3074 levels during the month.
-
Cycle: The next cycle due date is 2.15.24.
-
Strategy: If short, consider taking profits at the 2026-2014 levels.
This information suggests a bearish sentiment in the short term, with opportunities for profit-taking on short positions and potential reversal points for long positions. Traders should monitor the market closely for any changes in trend or momentum.
Read More: Gold Market Analysis: Navigating Volatility Amidst Economic Data, Geopolitical


