
M.photostock/iStock via Getty Images
Investment Thesis
iShares Select Dividend ETF (NASDAQ:DVY) warrants a hold rating due to a mix of factors impacting the fund compared to peer dividend-focused ETFs. While DVY has the highest dividend yield and most attractive valuation metrics compared to three other popular dividend funds, it has the lowest performance along with the least diversification. Therefore, although DVY is a solid choice for investors seeking dividend income, there are other dividend-seeking funds that have demonstrated significantly higher capital appreciation with lower expense ratios.
Fund Overview and Compared ETFs
DVY is an ETF that seeks to provide income through exposure to approximately 100 broad-cap U.S. companies with 5-year records of paying dividends. With its inception in 2003, the fund has 99 holdings and $17.90B in AUM. DVY’s heaviest weight by sector is on utilities (25.41%), followed by financials (24.80%) and consumer staples (8.89%).
For comparison purposes, other dividend ETFs examined were SPDR S&P Dividend ETF (SDY), Schwab U.S. Dividend Equity ETF (SCHD), and Vanguard High Dividend Yield ETF (VYM). While there are numerous other dividend-focused ETFs that exist, these funds were selected based on their popularity and high AUM. SDY seeks to track the performance of the S&P High Yield Dividend Aristocrats. The fund looks to include holdings with at least 20 consecutive years of both dividend income and capital appreciation. SCHD seeks to track the return of the Dow Jones U.S. Dividend 100 Index. It focuses on quality and consistency of dividend-producing holdings. SCHD’s largest sector weights are industrials (17.12%), followed by financials (16.73%) and health care (15.90%). Finally, VYM seeks to track the FTSE High Dividend Yield Index.
Performance, Expense Ratio, and Dividend Yield
DVY has a 10-year compound annual growth rate, or CAGR, of 8.83%. This 10-year performance has lagged all compared ETFs. By comparison, SDY has a 10-year CAGR of 9.60%, SCHD has a 10-year CAGR of 11.55%, and VYM has a 10-year CAGR of 9.91%.
10-Year Total Price Return: DVY and Compared Dividend-Focused ETFs (Seeking Alpha)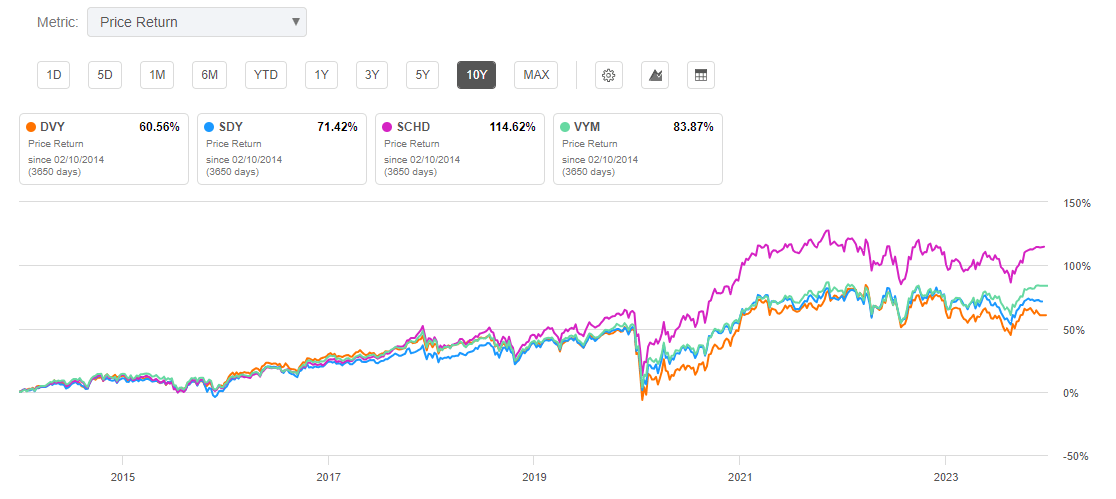
Another downside for DVY is its relatively high expense ratio. At 0.38%, DVY’s expense ratio is higher than all other dividend-focused funds. The primary advantage for DVY is its strong dividend yield. At 3.92%, DVY has the highest dividend yield compared ETFs. Additionally, DVY’s yield is growing with a 6.96% 5-year CAGR.
Expense Ratio, AUM, and Dividend Yield Comparison
|
DVY |
SDY |
SCHD |
VYM |
|
|
Expense Ratio |
0.38% |
0.35% |
0.06% |
0.06% |
|
AUM |
$17.90B |
$20.10B |
$52.71B |
$63.25B |
|
Dividend Yield TTM |
3.92% |
2.67% |
3.45% |
3.08% |
|
Dividend Growth 5 YR CAGR |
6.96% |
6.20% |
13.05% |
5.59% |
Source: Seeking Alpha, 9 Feb 24
DVY Holdings and Key Differences
Because each of the compared funds have different objectives and tracked indexes, their top holdings are significantly different. DVY is the least diversified fund of the compared ETFs at only 99 holdings. Additionally, DVY’s weight on its top 10 holdings is just under 20%. SCHD, in contrast, has over 40% weight on its top 10 holdings.
Top 10 Holdings for DVY and Compared ETFs
|
DVY – 99 holdings |
SDY – 136 holdings |
SCHD – 104 holdings |
VYM – 449 holdings |
|
IBM – 2.40% |
MMM – 2.24% |
AVGO – 5.03% |
JPM – 3.48% |
|
VZ – 2.37% |
O – 2.11% |
ABBV – 4.69% |
AVGO – 3.41% |
|
MO – 2.28% |
EIX – 1.77% |
MRK – 4.65% |
XOM – 2.87% |
|
OKE – 1.95% |
CVX – 1.75% |
HD – 4.34% |
JNJ – 2.68% |
|
STX – 1.94% |
IBM – 1.75% |
AMGN – 4.11% |
HD – 2.46% |
|
PRU – 1.89% |
ABBV – 1.74% |
CVX – 3.97% |
PG – 2.44% |
|
FNF – 1.82% |
TROW – 1.62% |
VZ – 3.92% |
MRK – 1.96% |
|
T – 1.79% |
XOM – 1.62% |
TXN – 3.88% |
ABBV – 1.94% |
|
LYB – 1.64% |
KMB – 1.61% |
PEP – 3.86% |
CVX – 1.77% |
|
F – 1.61% |
SO – 1.60% |
CSCO – 3.86% |
PEP – 1.66% |
Source: Multiple, compiled by author on 9 Feb 24
All ETF investors know that a fund’s future performance is tied to the return of its individual holdings. Key holdings that represent distinct differences for the ETF are International Business Machines Corporation (IBM), Prudential Financial, Inc. (PRU), Broadcom Inc. (AVGO), and AbbVie Inc. (ABBV). These key differences in holdings are discussed in further detail below.
Advantage #1 – Top Holding of IBM
Despite a lower performance compared to peer funds, DVY has several advantages in its holdings. The first difference is its top holding of IBM. The IT solutions company has demonstrated both solid growth and profitability, including an 11.38% YoY EBITDA growth, 55.45% gross profit margin, and 33.79% return on common equity. Although IBM has a one-year performance of over 35%, it is still favorably valued with a forward P/E…
Read More: DVY: Solid Dividend Yield, But There Are Better Options For Dividend-Focused