BTC/USD Signal Today – 22/04: Bitcoin Awaits News (Chart)
Bullish view
- Buy the BTC/USD pair and set a take-profit at 68,000.
- Add a stop-loss at 60,000.
- Timeline: 1-2 days.
Bearish view
- Set a sell-stop at 63,000 and a take-profit at 60,000.
- Add a stop-loss at 65,000.
Bitcoin price held steady on Monday after the network went through its fourth halving during the weekend. It also rebounded as geopolitical risks eased. The BTC/USD pair jumped to above 64,000, much higher than last week’s low of 59,767.
Bitcoin waits for next catalyst
Bitcoin price remained in a tight range on Monday morning as investors continued waiting for the next catalyst. The coin’s two crucial catalysts have already happened this year.
The Securities and Exchange Commission (SEC) has already approved spot Bitcoin ETFs, which have attracted billions in funds in the past few months. For example, the iShares Bitcoin Trust (IBIT) has over $18 billion in assets while the Fidelity Wise Origin Bitcoin fund has added over $10 billion in assets.
The other important catalyst for Bitcoin happened during the weekend when the network went through a halving event. Halving is the process where the network reduces block rewards to miners in a bid to slow the production process.
Therefore, Bitcoin is contending with higher demand from ETF providers and slow coins. Most notably, this is happening at a time when supply in exchanges has dipped. The dip is a reflection that most people and companies have moved their coins to cold wallets, which are not connected to the internet.
Bitcoin is now entering a calm period when there are no internal catalysts since halving and ETF approvals have already been done. The most likely catalyst will be macro and geopolitical events.
Last week, the coin dropped sharply after Israel launched a counterattack on Iran. These losses were short-lived because the attack was limited. As such, there is a likelihood that the crisis will not escalate.
The BTC/USD pair will also react to the actions of the Federal Reserve, which is expected to maintain restrictive interest rates this year.
BTC/USD technical analysis
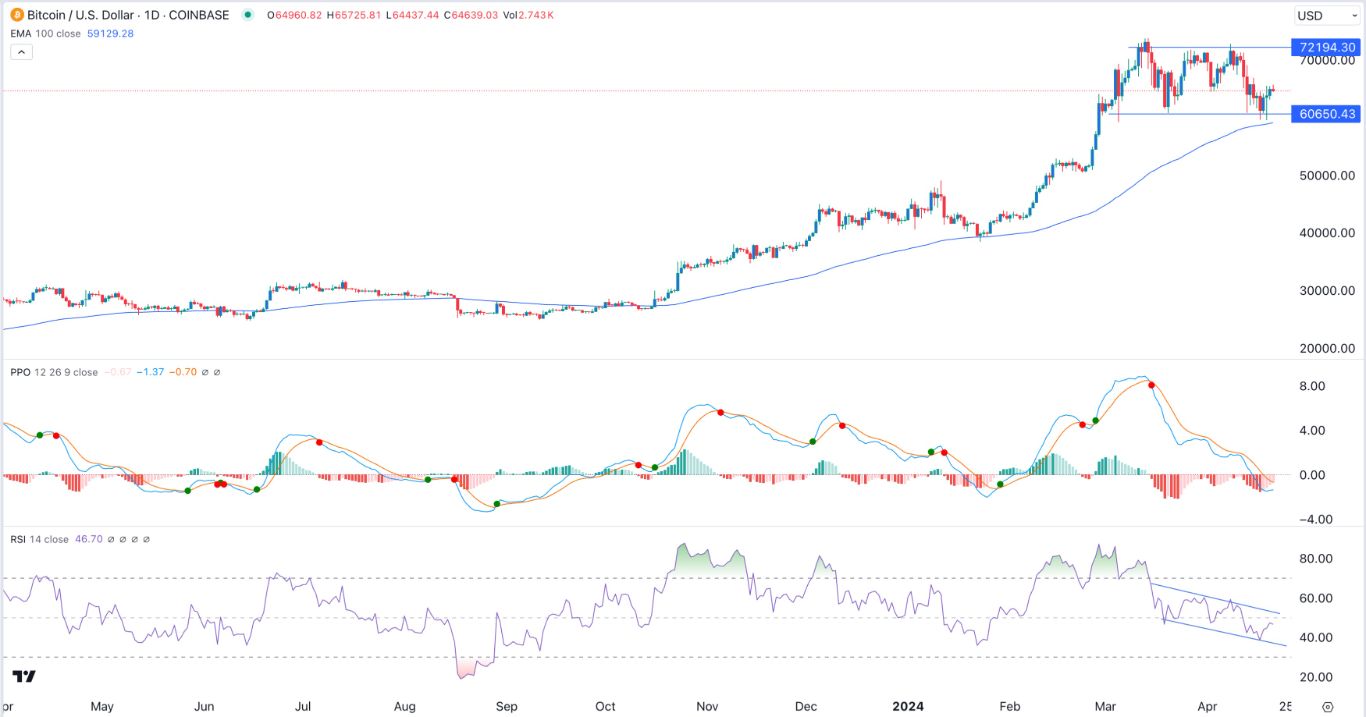
The daily chart shows that the price of Bitcoin has moved sideways in the past few weeks. In this period, it has remained between the lower side of 60,000 and the upper resistance point at 72,200.
Bitcoin has constantly moved above the 100-day moving average, which is a positive thing. The other positive catalyst is that it has formed a bullish flag pattern, which is a positive sign.
On the other hand, the Relative Strength Index (RSI) has formed a descending channel while the Percentage Price Oscillator (PPO) has moved below the neutral point. Therefore, the outlook for the pair is neutral. A break below the support at 60,000 will point to more downside.
Ready to trade our daily Forex signals? Here’s a list of some of the best crypto brokers to check out.
Read More: BTC/USD Signal Today – 22/04: Bitcoin Awaits News (Chart)


