
primeimages
ETF Snapshot
With a listing history of 25 years and AUM of $57bn, the Technology Select Sector SPDR ETF (NYSEARCA:XLK) is one of the pre-eminent tech-focused products around, offering exposure to the largest tech stocks in the US. Put another way, this product focuses exclusively on the tech stocks that comprise the S&P500. Companies that make up this portfolio are typically involved in tech sub-terrains such as hardware, software, storage, semiconductor, IT services, electric equipment, and communication services, amongst others.
Which is better – XLK or VGT?
When investors are contemplating a position in XLK, the competing alternative they are typically presented with is the Vanguard Information Technology ETF (VGT), which has managed to amass a larger chunk of AUM over time ($67bn), despite coming to the bourses nearly 6 years after XLK’s debut. Note that both products have identically low expense ratios of 0.1%, and the yield on offer too is not poles apart (0.75% for XLK vs 0.68%), but a lot of investors are probably attracted to the broader reach of VGT.
Unlike XLK which only focuses on 67 tech stocks (consisting of an overwhelming majority of mega and large-cap stocks, which total up to 92% of the portfolio), VGT spreads its tentacles across 321 tech stocks and also offers some useful exposure to mid-small and micro-cap stocks which account for over a fifth of its total holdings.
Morningstar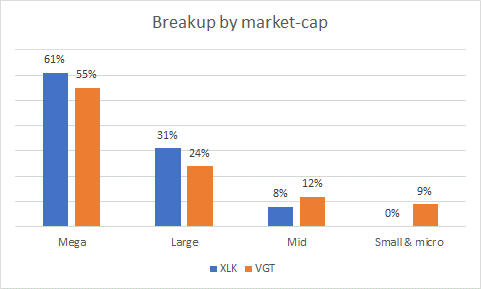
On paper, mid and small-cap stocks are believed to have a better earnings runway, and this may have been a big draw for investors. For instance, as per Morningstar data, historically, XLK’s holdings have delivered a weighted average earnings profile of 7.89%, whereas VGT’s holdings have managed to deliver a corresponding figure in the double-digit range (nearly 12%).
Because of its more diversified positioning, VGT may be winning the AUM war, but so far, since it came to the bourses in 2004, VGT has underperformed our focus ETF on a total return basis.
YCharts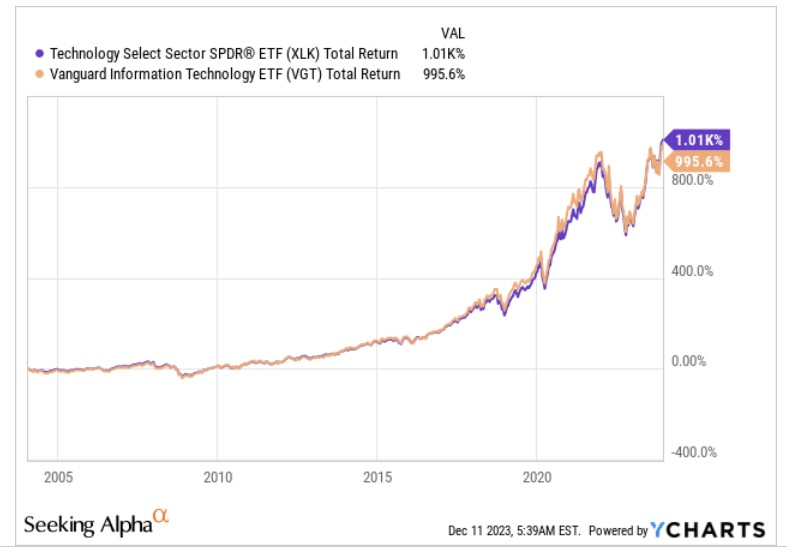
It’s also fair to say that large-cap business models are more well-rounded with stronger balance sheets; this filters through to an overall lower risk profile for XLK vs VGT, and we can see that it in the variation of the monthly returns, be it on a short (5-year), medium (10-year) or long-term (15-year) basis. The image below highlights how XLK’s standard deviation has consistently lagged that of VGT’s.
YCharts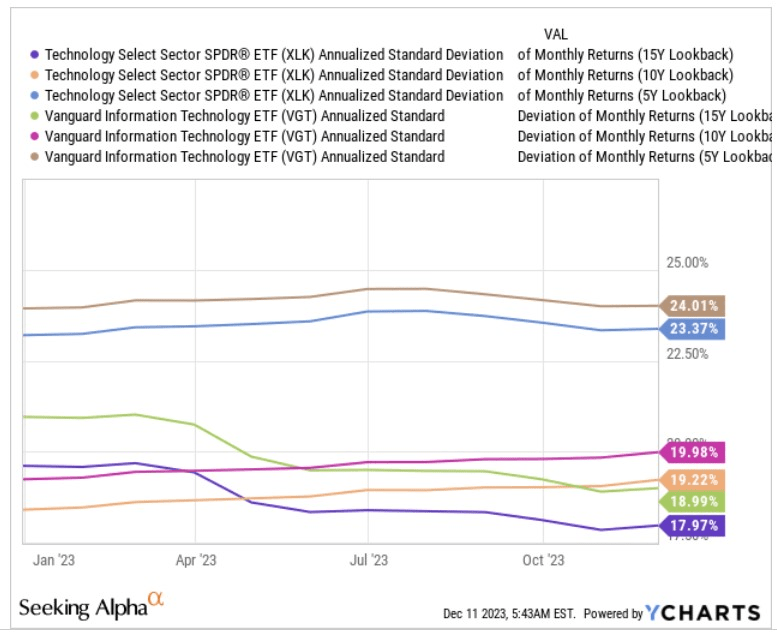
When you combine a superior return profile, with a lower risk profile, you’re getting better bang for buck, and that’s reflected in the Sharpe ratios of the two products over the short, medium, and long term. The image below highlights how for every unit of total risk taken, XLK manages to deliver a superior threshold of excess return over the risk-free rate (note that VGT delivers sub-par excess returns on a 5-year basis).
YCharts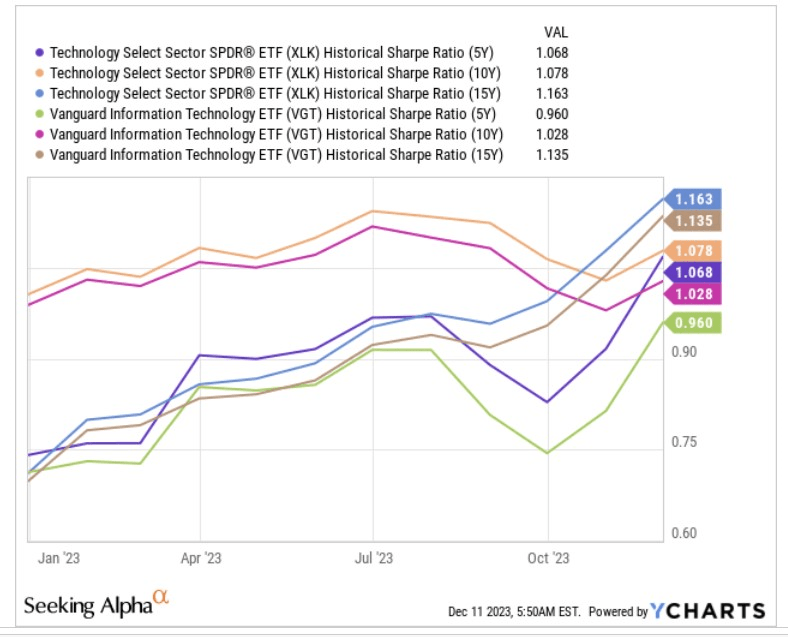
If you’re looking for further nuances, one may perhaps also look at how well these ETFs have fared in the face of only harmful volatility. To ascertain this we switch to the Sortino ratio across different time frames, and here we can see that both products do exceedingly well delivering numbers well ahead of 1x, but once again XLK comes out on top across all 3 time frames.
YCharts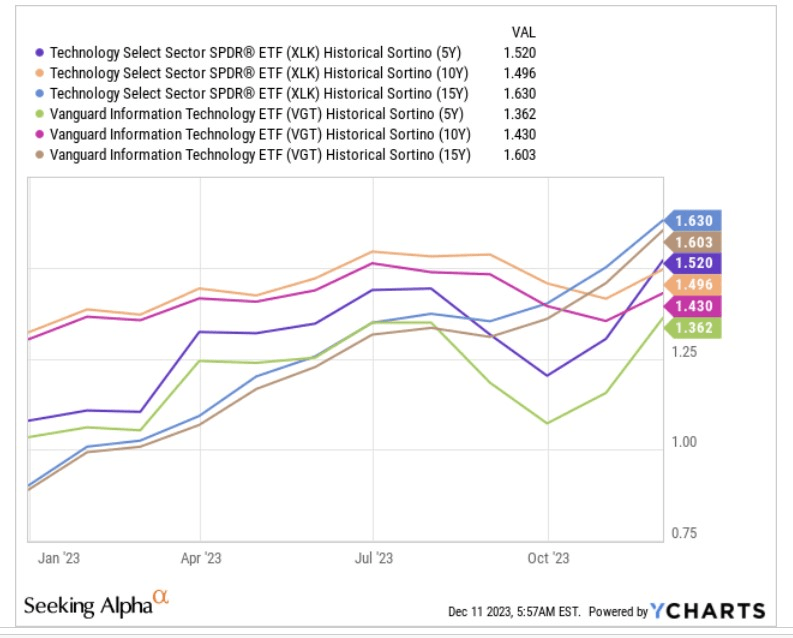
Closing Thoughts – Is XLK A Good Buy Now?
Whilst XLK may come across as the superior product and the preferred way to play tech, we are filled with ambivalence about its prospects going forward. Here are some of the good and bad considerations driving our neutral rating.
To start off, momentum in the tech space is increasingly strong, and with good reason. Since the start of Q4 until now (Dec 8th), it has been leading all 11 sectors that comprise the S&P500, with capital appreciation to the tune of 13%. XLK alone has seen a tremendous deal of fund flows over the last two months which have pretty much overshadowed what we’ve seen previously.
ETF.com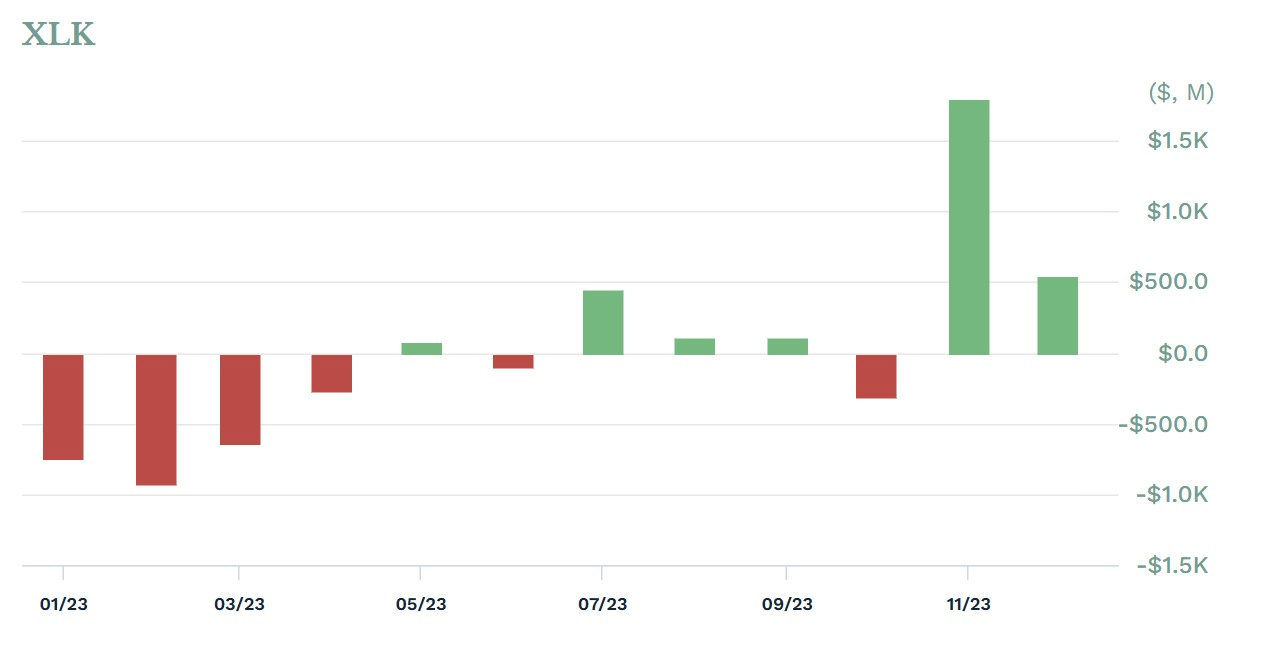
The increased interest here is mainly driven by a range of upward earnings revisions, with expected annual earnings growth rate for the tech sector leading all sectors at 15.1% (compared to 13.9% earnings growth at the start of Q4).
FactSet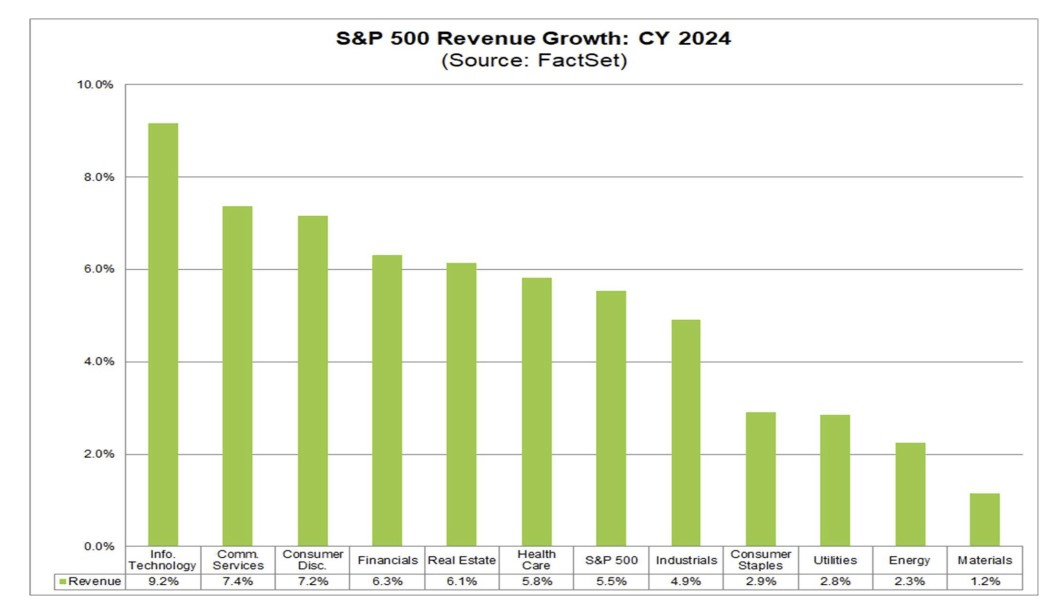
Even if you look to next year, i.e., FY24, the tech component of the S&P500 looks set to lead all other sectors in terms of annual revenue growth (expected figure of 9.2%).
The tech sector’s profit margin too is expected to be very resilient next year (lagging only the real estate sector), but crucially it will also be the sector that will see the largest expansion in net profit margins (around +170bps)
FactSet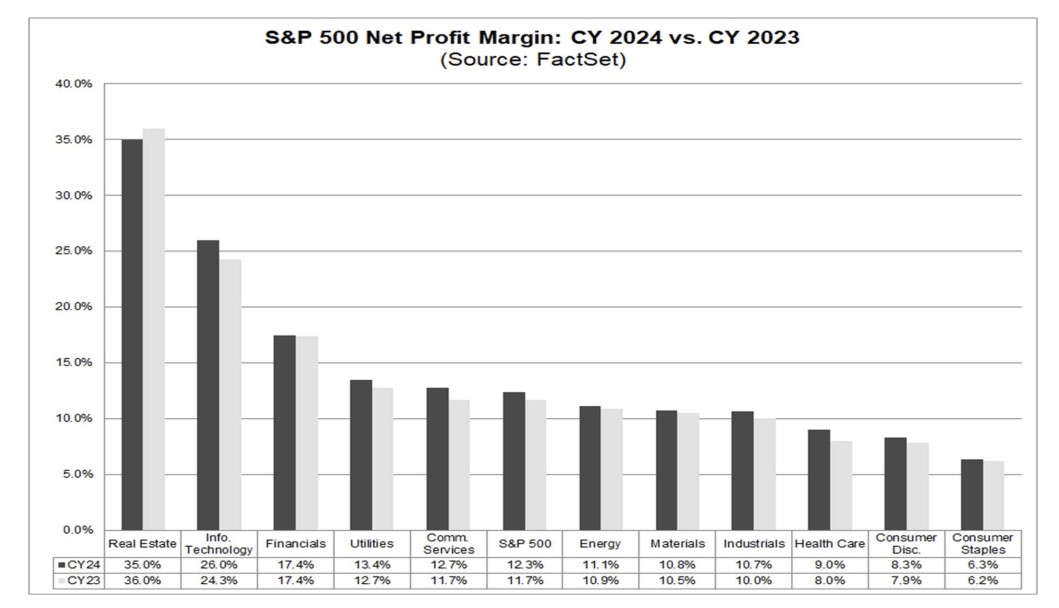
When it comes to XLK it’s fair to say that its top 10 holdings have a strong degree of clout (70% of the total portfolio) and the earnings and valuation quotients of these 10 names in particular will weigh…
Read More: XLK ETF: Solid Qualities, But Not The Most Optimal Point To Stage An Entry