
Recently leaked court documents during Microsoft Corp.’s ActivisionBlizzard hearing require us to revisit our cloud forecasts and market share data. The poorly redacted docs, which have since been removed from public viewing, suggest that Microsoft’s Azure revenue is at least 25% lower than our previous estimates.
As a result, we’ve cut and revised our Azure revenue figures, which in turn increases Amazon Web Services Inc.’s Big Four hyperscale cloud market share. Our new estimates show that AWS maintains a greater than 50% share of revenue through 2023. Although the change also helps Google Cloud, its market share is only modestly affected.
In this Breaking Analysis, we update our hyperscaler cloud revenue estimates and market share data. We’ll also explain how the Enterprise Technology Research data on cloud should be interpreted in this context and look forward to potential catalysts for cloud growth, including acceleration in the fourth quarter attributable to generative AI.
Don’t use a Sharpie to redact documents
The story was well-covered in the press. The media picked up on Google analysis in late 2022 on a similar manner, but the Activision hearing let the cat out of the bag… oops!
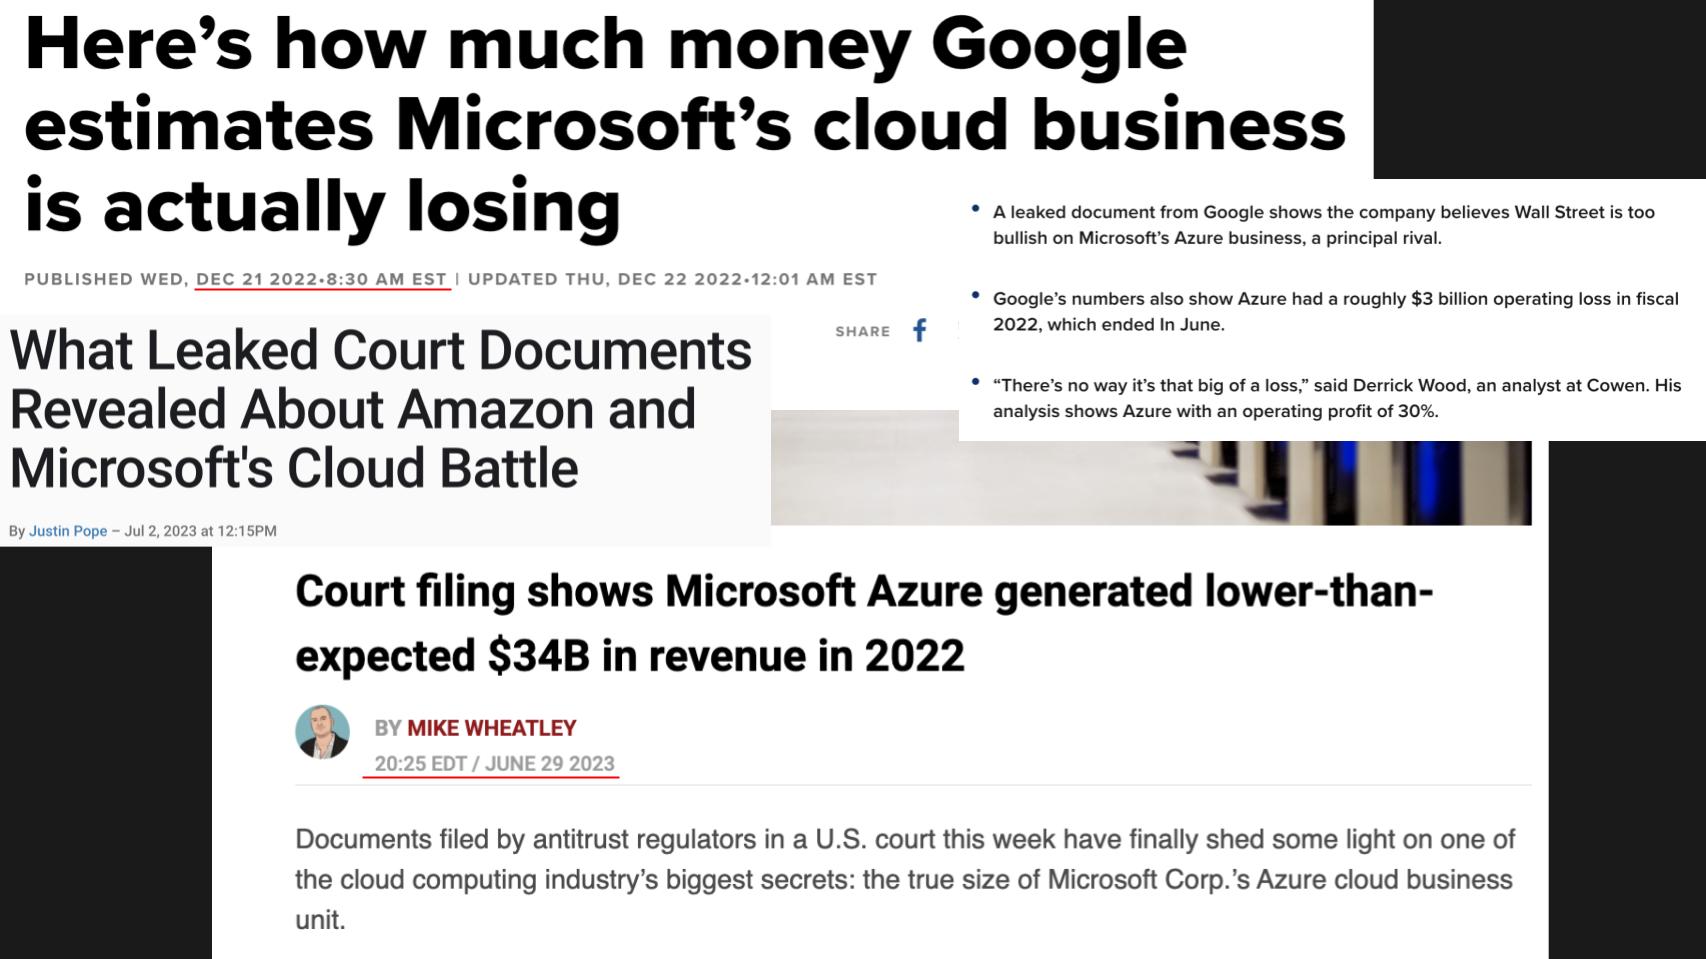
Last month as part of the Federal Trade Commission’s attempt to block the Microsoft-Activision deal, Microsoft submitted redacted documents to the court that pegged its Azure revenue for its fiscal 2022 at $34 billion. That’s the four periods from June 2021 to June 2022. It’s more than $10 billion lower than most analyst estimates, including ours.
How are we to interpret this data? On the one hand, it helps Microsoft show data that it has significant competition in the cloud and doesn’t have a monopoly. Further, Microsoft can basically put revenue in whichever bucket it wants. Moreover, no one can seem to get hands on the poorly redacted documents to see the exact context.
For example, here’s some detail we’d like to see: Microsoft claims to have a $20 billion cybersecurity business. Is any of that revenue counted in Azure? If so how much? If not, why not?
Regardless of the many questions, this revelation can’t be ignored. It’s highly unlikely that Microsoft would produce data in court documents that would not be consistent with how it reports its business internally. So we have to adjust our cloud figures.
The opacity of cloud IaaS and PaaS reporting
Before we get into the revised data, let’s remind you that only AWS reports its infrastructure-as-a-service and platform-as-a-service data in a reasonably clean manner. Microsoft reports Azure growth rates and Alphabet Inc. gives hints about its IaaS and PaaS businesses. But neither gives specific revenue figures. Below we show some examples. 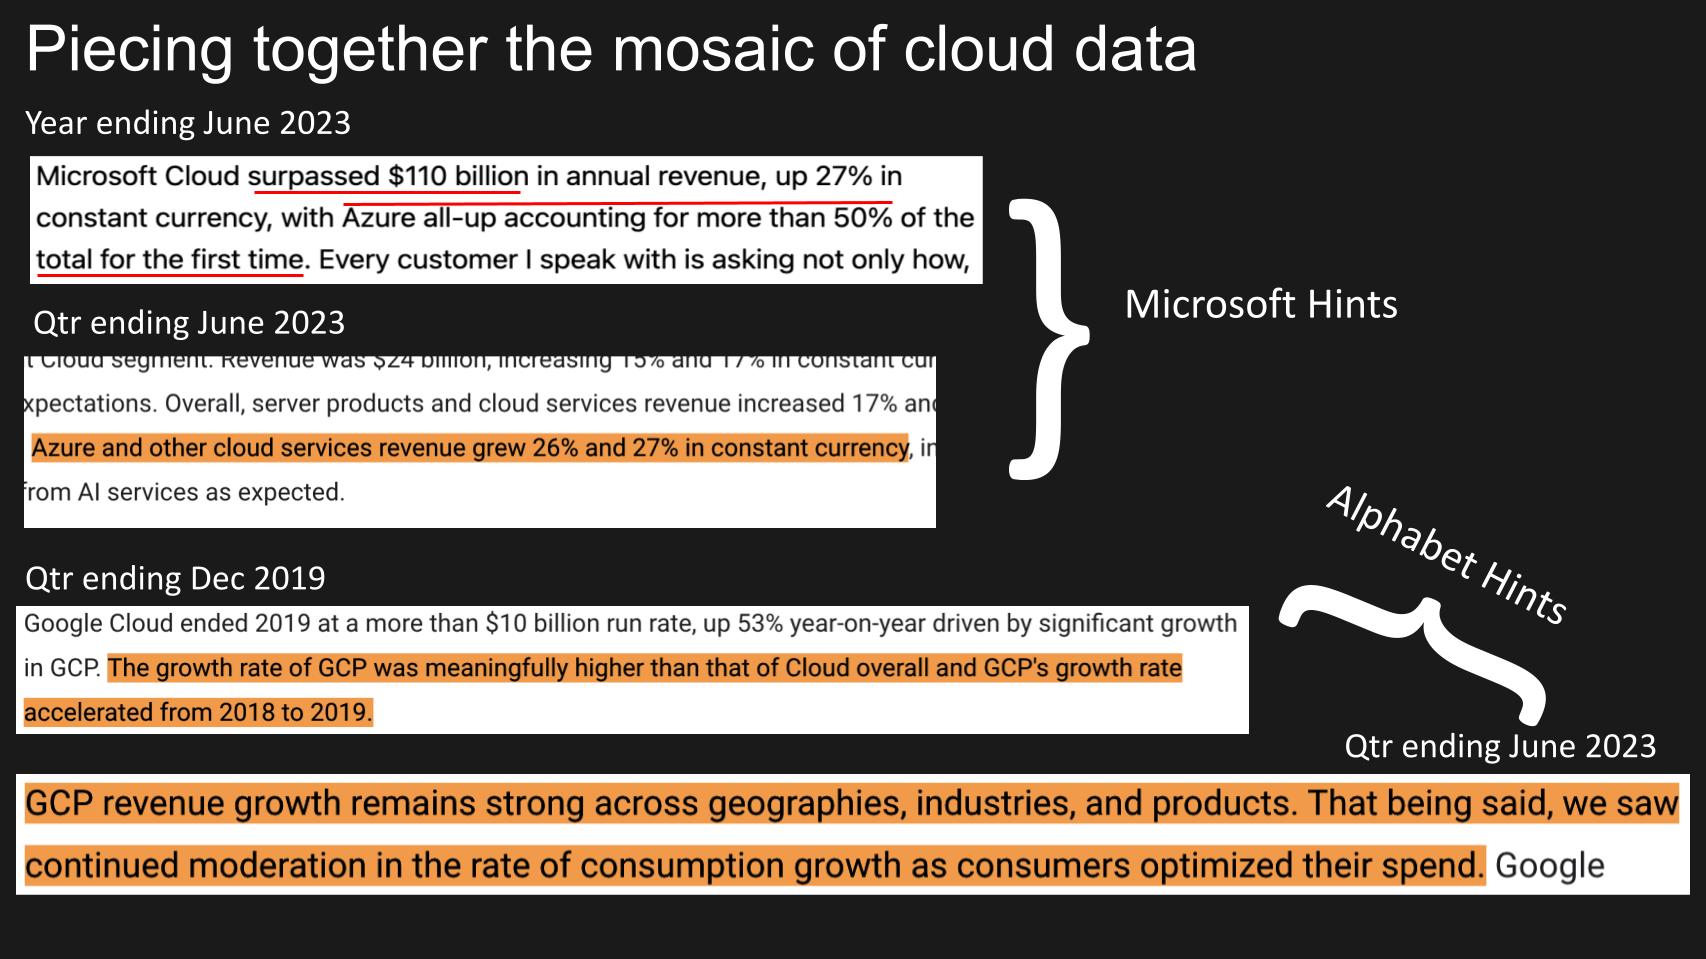
In this past earnings print, Microsoft gave more information than it ever has regarding Azure. The company cited that Azure’s annual revenue, for the first time, surpassed 50% of the Microsoft Cloud total, a figure it always reports. Microsoft consistently gives specific figures on Azure growth rates each quarter.
Taking those into consideration as gospel and pinning fiscal year 2022 at $34 billion (the leaked figure), we can get close to 50% but not quite. So we’re left asking ourselves: Which figures are correct? The quarterly growth rates or the most recent disclosure? And how reliable are the leaked numbers?
We’ve always been dubious of the $34 billion leaked figure and felt the number was larger. But given the lack of transparency, we’ll err on the conservative side and have decided to reduce Azure’s revenue in our model.
Revised hyperscaler IaaS and PaaS figures shift market shares
So what does this mean for our previous forecasts? Let’s take a closer look at the data.
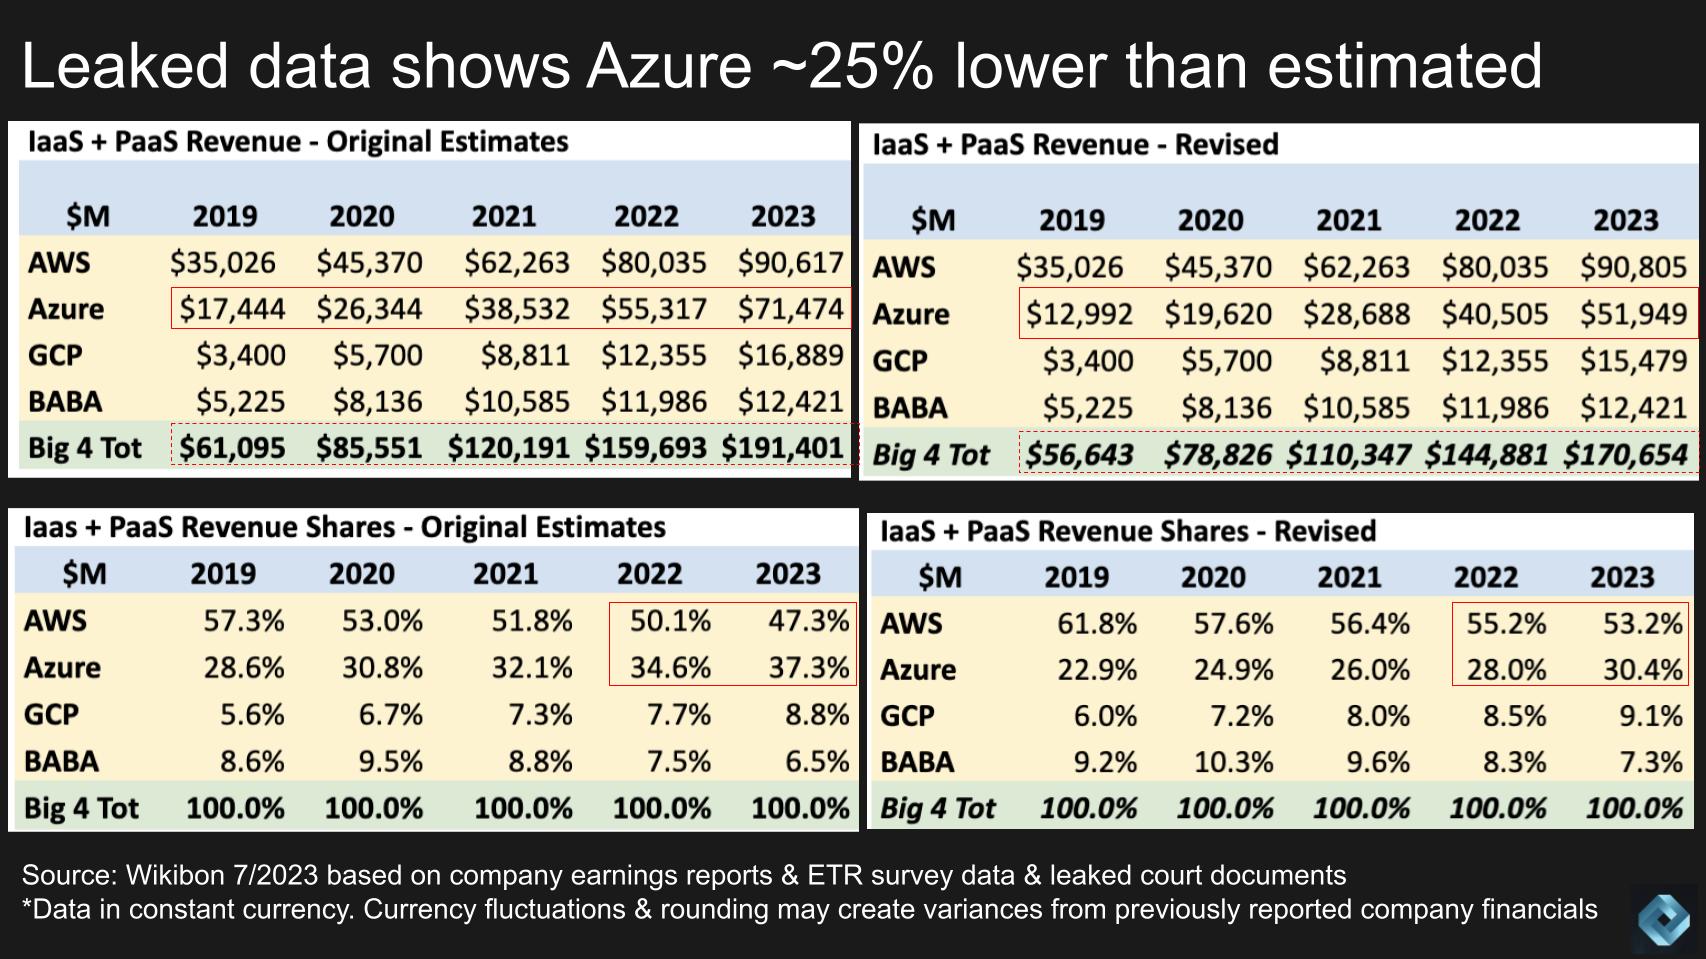
Above, on the lefthand side of this graphic, we show our previous estimates for the Big Four hyperscalers. The top chart is worldwide IaaS and PaaS revenue and the bottom is market share data prior to the leaked documents.
On the right hand side we show the same data for our revised estimates. Let’s review the meaningful changes:
- The Azure data has dropped considerably, by more than 25%. Normalizing Microsoft’s fiscal years into calendar years, Azure revenue goes from $55 billion to $40 billion in 2022.
- As such, Azure’s market share in that period drops from around 35% to 28%.
- Meanwhile, the impact on AWS is meaningful. While you see on the lower left, we had AWS dropping to 50% in 2022 and below 50% in 2023, the revised estimates indicate that AWS had a 55% share in 2022.
- We expect that share to hold up in the low 50s – 53.2% in 2023.
- Though the change helps GCP look better, it’s not nearly as significant because of its smaller base.
Lastly, the overall market size in our model has been…
Read More: What leaked court docs tell us about AWS, Azure and Google cloud market shares