
Emerging markets are sometimes ignored by investors. However, investing in these markets can still be profitable. Therefore, in this article, we’ll take a look at two of the most popular emerging market ETFs, the Vanguard FTSE Emerging Markets ETF (NYSEARCA:VWO) and the iShares MSCI Emerging Markets ETF (NYSEARCA:EEM), and determine which one looks better.
Why Invest in Emerging Markets?
The International Monetary Fund (IMF) recently forecasted that emerging markets would enjoy 4.1% real GDP growth in 2024, comfortably surpassing the relatively tepid 1.4% real GDP growth predicted for developed markets.
As an added bonus, despite this upside, emerging market stocks are significantly cheaper than their developed market counterparts — for example, the S&P 500 (SPX) sports an average P/E multiple of 20.3, while the average P/E multiple for the iShares MSCI Emerging Markets ETF is just 11.7
U.S. markets have surged this year. The S&P 500 is up 16.5% year-to-date, and the Nasdaq (NDX) is up 32%, meaning that it could be a good time to invest in emerging markets as they try to stage a rally to catch up with the U.S. market.
Interestingly, Falcon Wealth Planning President Gabriel Shahin recently told The Wall Street Journal, “This is a smart contrarian play for investors who want to diversify their portfolios geographically…There is a fire sale going on in emerging-market stocks, and this is one of the smartest plays in equity investing right now.”
What are the VWO and EEM ETF’s Strategies?
The popular VWO is the largest emerging markets ETF with a substantial $72.8 billion in assets under management (AUM). Vanguard says that this ETF “invests in stocks of companies located in emerging markets around the world, such as China, Brazil, Taiwan, and South Africa” by investing in its underlying index, the FTSE Emerging Markets All Cap China A Inclusion Index.
Meanwhile, EEM is far smaller than VWO but still boasts a considerable $20.3 billion in AUM. EEM gives investors “exposure to large and mid-sized companies in emerging markets” by investing in its underlying index, the iShares MSCI Emerging Markets ETF.
Comparing Their Portfolios
VWO offers investors tremendous diversification. It owns an incredible 4,680 stocks, and its top 10 holdings make up just 20.1% of the fund’s assets.
Below, you can take a look at VWO’s top 10 holdings using TipRanks’ holdings tool.
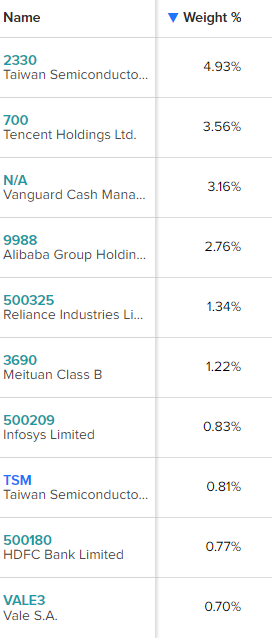
Many investors will likely be familiar with VWO’s top holding, Taiwan Semiconductor (NYSE:TSM), as well as Chinese internet giants like Tencent (OTC:TCEHY), Alibaba (NYSE:BABA) and Meituan (OTC:MPNGF), and India’s largest company, Reliance Industries. Note that VWO owns the locally-listed shares of these companies, not the U.S.-listed shares.
The fund is also diversified geographically and across industries. China has a 31.8% weighting in the ETF, followed by India and Taiwan, which have weightings of 18.7% and 17.8%, respectively.
While EEM doesn’t own as many stocks as VWO, it still offers investors plenty of diversification, with 1,246 holdings. Furthermore, its top 10 holdings make up just 22.9% of assets.
Below, you’ll find an overview of EEM’s top 10 holdings.

Like VWO, EEM’s top holdings include the likes of Taiwan Semiconductor, Tencent, Alibaba, Meituan, Reliance Industries, and more. EEM is similar to VWO when it comes to the geographic breakdown of its investments. China has a 29.6% weighting within the fund, while Taiwan and India have weightings of 15.6% and 14.8%, respectively.
Interestingly, one key difference between the two funds is that EEM has a significant 12.5% weighting towards South Korea, while VWO does not invest in South Korean stocks. This is because EEM’s underlying index considers South Korea to be an emerging market, while VWO’s does not. That’s why Samsung is a top-three holding for EEM but not for VWO.
How Have These ETFs Performed?
In terms of performance, neither of these ETFs has exactly lit the world on fire as emerging markets have underperformed developed markets for many years.
VWO has been roughly flat over the past three years on an annualized basis. Over the past five years, it has had an annualized return of 2.2%, and over the past ten years, it has had an annualized return of 3.5%.
EEM has lost 2.2% on an annualized basis over the past three years. Over the past five years, it has returned a paltry 0.3% on an annualized basis, and over the past 10 years, it has a total annualized return of 2.3%.
So, VWO has slightly outperformed EEM over each time frame, although in reality, neither ETF has much to brag about when it comes to its performance. However, this…
Read More: VWO vs. EEM: Which Emerging Market ETF is Better?