
Torsten Asmus
Natural gas prices are down about 80% from their highs nine months ago and down 60% from their levels only five months ago. This has likely contributed to sluggishness in natural gas stocks, as evidenced by the performance of the First Trust Natural Gas ETF (FCG) over that same period of time. Unsurprisingly, the collapse in natural gas prices is reflected in the abysmal performance of commodity-tracking ETFs like the United States Natural Gas Fund, LP ETF (NYSEARCA:UNG) and the United States 12 Month Natural Gas Fund, LP ETF (UNL).
Chart A. Natural gas prices and related ETFs have declined significantly the last nine months. (StockCharts.com)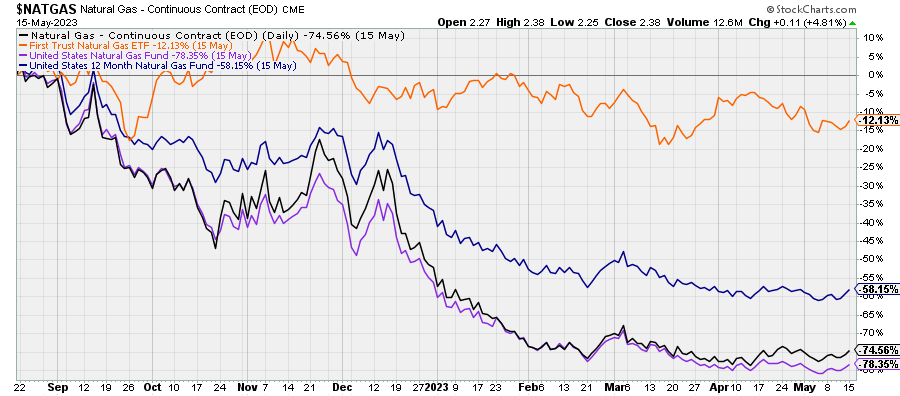
In this article, I am going to argue towards the following conclusions:
- Natural gas prices are likely to see a substantial rise over the next 16-24 months.
- Neither UNG nor UNL are, at present, good instruments to take advantage of such a rise due to the pronounced contango in the natural gas market at the moment.
This is based on an analyses of commodity cycle dynamics within current macro conditions and the history of natural gas prices over the last 60 years.
In a subsequent article, I intend to argue that, although natural gas prices are likely to stabilize if not rise:
- Natural gas equities – particularly in the exploration and production space, such as those represented in FCG – are not likely to significantly benefit from even a doubling of prices.
- Over the longer term, natural gas stocks are likely to outperform the broader equity market and exchange-traded funds, or ETFs, like UNG and UNL, but they are likely to suffer from a period of low absolute returns.
For now, however, let’s begin with the outlook for natural gas prices.
Commodity principles
In December, I wrote “DBE ETF: Energy Prices Likely To Start Leading Market Down.” I argued there that markets, including commodity markets, have likely entered a “secular” period of lower returns and that we are probably in a cyclical downturn within that “secular” bear market. That cyclical downturn might be expected to last at least until 2024 while a more general period of depressed returns could last well into the 2030s. In the meantime, I argued, energy prices were likely to feel the brunt of that cyclical downturn, more so than precious metals, industrial metals, and agricultural commodities. So far, there has not been much reason to change that general outlook on energy, but it appears that natural gas may be somewhat oversold now, and the underlying rationale behind the energy outlook points to an idiosyncratic trajectory for natural gas. In other words, we are likely to see stabilization in natural gas prices before we see it in the rest of the energy complex.
I have described the approach that will be employed here in greater detail in previous articles, including a general piece on commodities in March of last year. For now, however, I will briefly recap some of those elements and how they relate to natural gas prices.
We can divide commodity price behavior into structural, super cyclical, and cyclical tendencies. Structurally, commodity prices collectively tend to be flat over centuries, and individually they tend to follow a simple formula: price = 1/supply, which suggests that price is not driven primarily by supply-demand dynamics.
Rather, real commodity prices have been consistently correlated with the earnings yield on equities for the last 150 years. As the chart illustrates below, this has been less true for natural gas prices (presumably because it is not as fungible as most other primary commodities).
Chart B. Commodity prices have historically tracked the earnings yield, although natural gas prices are less obedient to this rule. (World Bank, St. Louis Fed, Robert Shiller data, S&P Global)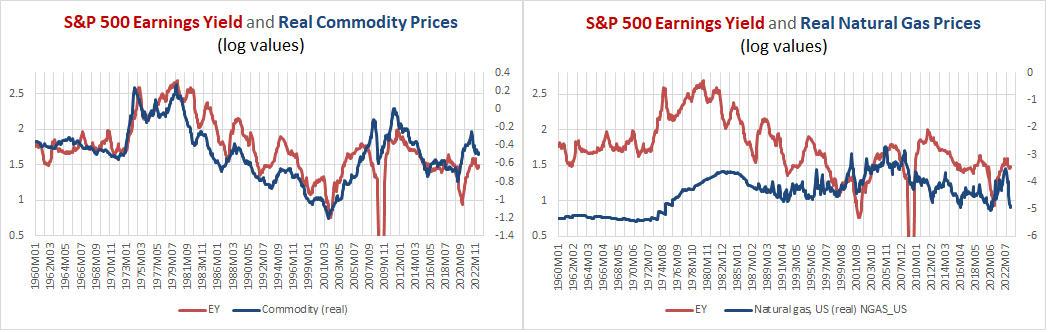
On top of this, decade-long commodity super cycles occur during periods marked by increased global instability (as reflected in global deaths in battle) and periods that are marked by the transition from one dominant technological paradigm to another. This was discussed in greater detail in the series Conjunction & Disruption: Technology, War, And Asset Prices. On the flip side, commodity prices tend to be depressed during periods of rising PEs, increasing global stability, and the diffusion phase of a disruptive innovation (for example, autos and radios, TVs, PCs, smartphones).
And, since the establishment of the Federal Reserve, super cyclical waves in commodity prices (and the phenomena associated with them) have occurred every 30 years (for example, the 1910s, 1940s, 1970s, and 2000s). Apart from a few particulars, this is the modern form of Kondratiev Waves, as discussed in that series.
Finally, commodity prices also have a cyclical mode of behavior. Generally, they rise and fall with…
Read More: UNG: Why Natural Gas ETFs Could Disappoint (Technical Analysis) (NYSEARCA:UNG)