
Seiya Tabuchi
The Vanguard High Dividend Yield Index Fund ETF (NYSEARCA:VYM) is known for being a well-diversified, low-cost, dividend growth fund that greatly streamlines the process of building a passive income snowball for investors who want a completely hands-off experience that saves their time and mental energy for other pursuits.
However, VYM is not the only option out there, as there are many other popular dividend growth ETFs that offer similar products to VYM. In this article, we will compare VYM to the following other high-yield ETFs and offer our take on how it stacks up against its competition:
- JPMorgan Nasdaq Equity Premium Income ETF (JEPQ)
- JPMorgan Equity Premium Income ETF (JEPI)
- Amplify CWP Enhanced Dividend Income ETF (DIVO)
- Schwab U.S. Dividend Equity ETF (SCHD)
- SPDR® Portfolio S&P 500 High Dividend ETF (SPYD)
- Invesco S&P 500® High Dividend Low Volatility ETF (SPHD)
Total Return Track Record
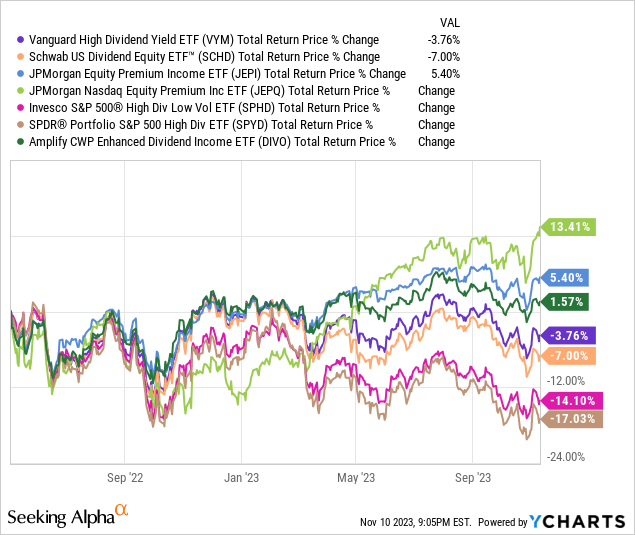
Over the past year and a half, VYM has posted a middling total return performance relative to peers. As illustrated in the chart below, VYM generated a total return of -3.76%, which was surpassed by JEPI, JEPQ, and DIVO, all of which were boosted by their significant exposure to mega-cap technology stocks that have generated tremendous outperformance over that period. That being said, VYM still significantly outperformed other high-yielding dividend growth ETFs like SCHD, SPHD, and SPYD, showing that for more value-focused funds, VYM has weathered recent headwinds quite well:
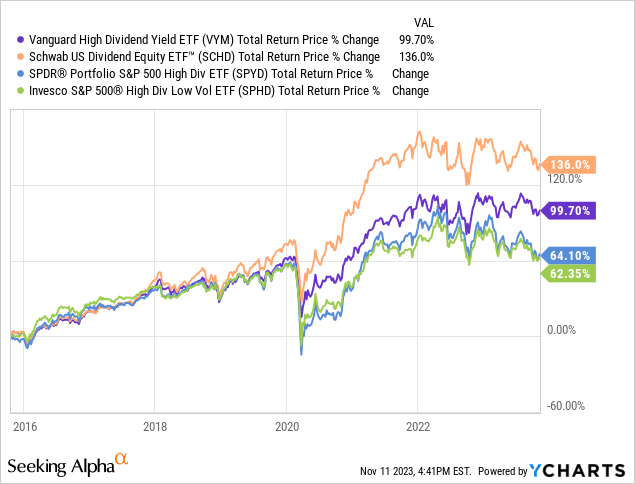
Over the longer term, VYM has performed pretty well against the funds that have been around since then, outperforming SPYD and SPHD, while trailing SCHD:
Dividend Yield & Growth Track Record
VYM’s trailing twelve-month dividend yield and 5-year dividend per share CAGR is solid, with a TTM dividend yield of 3.27% and a respectable 5-year dividend CAGR of 5.60%, indicating that its income stream is growing faster than the long-term rate of inflation. In contrast, JEPI and JEPIQ have very inconsistent payouts (due to the lumpy nature of their options premiums, which account for the vast majority of the cash flow that they distribute to shareholders). That being said, both ETFs offer high current TTM dividend yields, with JEPIQ at 10.94% and JEPI at 9.26%, which are substantially higher than the other ETFs, making them potentially attractive for investors seeking current income.
SCHD stands out with the highest 5-year dividend CAGR at 13.69%, paired with a TTM dividend yield of 3.77%, which suggests that investors in SCHD have enjoyed significant dividend growth alongside a yield that is above the average for U.S. equities, making it an exceptional dividend growth ETF.
On the lower end of the dividend growth spectrum, SPHD and DIVO have 5-year dividend CAGRs of 2.49% and 2.61%, respectively. While these growth rates are modest, they are generally in line with long-term inflation averages and come with very attractive TTM dividend yields of 4.80% for SPHD and 4.91% for DIVO, making them attractive sources of current income. SPYD is quite similar in its growth and yield profile to SPHD and DIVO, with its 5-year dividend CAGR of 2.72% and a TTM dividend yield of 5.24%.
| ETF | 5-Yr Dividend CAGR | TTM Dividend Yield |
| VYM | 5.60% | 3.27% |
| JEPQ | N/A | 10.94% |
| JEPI | N/A | 9.26% |
| SCHD | 13.69% | 3.77% |
| SPHD | 2.49% | 4.80% |
| DIVO | 2.61% | 4.91% |
| SPYD | 2.72% | 5.24% |
Expense Ratio
Expense ratios are a critical factor to keep in mind when evaluating an ETF because they directly impact an investor’s net returns, especially over the long term. Even a seemingly small difference in expense ratios can have a significant effect on an investment’s growth potential over time due to the compounding effect that it has year after year. Over the long term, a higher expense ratio can consume a considerable portion of a fund’s gains. Therefore, a lower expense ratio is often seen as a competitive advantage for an ETF, especially when compared to another ETF that has a similar investing strategy.
Both JEPQ and JEPI have moderate expense ratios of 0.35%. While this is one of the higher expense ratios in this list of ETFs, it is important to keep in mind that both JEPQ and JEPI are actively managed and generate significant cash flow through options trading, thereby warranting some of the additional fees that investors pay for access to the services that these ETFs supply.
In comparison, the Amplify CWP Enhanced Dividend Income ETF, identified by its ticker DIVO, has an even higher expense ratio of 0.55%. This is not entirely surprising given that DIVO is also actively managed and trades some options as well, so it generally has more operating expenses than passively managed ETFs.
On the more cost-effective side, passively…
Read More: Passive Income Snowball: How Does VYM Stack Up Against Six Competing ETFs?