
PeopleImages/iStock via Getty Images
Investment Thesis
iShares Core S&P Mid-Cap ETF (NYSEARCA:IJH) warrants a buy rating due to its low-cost ability to capture the growth potential of a diversified mix of over 400 mid-cap holdings. Despite its comparative underperformance, lowering interest rates and the high valuation of large and mega-caps currently may make mid-cap stocks a desirable option this year. Furthermore, IJH has the most attractive valuation metrics in comparison to other top peer mid-cap ETFs.
Fund Overview and Compared ETFs
IJH is an ETF that seeks to track the results of an index composed of mid-cap U.S. equities and is focused on long-term growth. With its inception in 2000, the fund has 405 holdings and $78.34B in AUM. IJH has the greatest sector weight on industrials (21.58%), followed by financials (15.73%) and consumer discretionary (15.69%).
For comparison purposes, other mid-cap ETFs examined are Vanguard Mid-Cap ETF (VO), Schwab U.S. Mid-Cap ETF (SCHM), and Invesco S&P Mid-Cap Quality ETF (XMHQ). VO seeks to track the CRSP U.S. Mid Cap Index and to capture the performance of diversified mid-size companies. SCHM seeks to track the total return of the Dow Jones U.S Mid-Cap Total Stock Market Index. The fund aims to provide a low-cost method to achieve long-term growth through U.S. mid-cap equities. XMHQ is based on the S&P MidCap 400 Quality Index. The fund is rebalanced semiannually based on three proprietary factors. It is heaviest on industrials (29.66%), followed by consumer discretionary (17.41%) and information technology (15.37%).
Performance, Expense Ratio, and Dividend Yield
IJH has a 10-year compound annual growth rate, or CAGR, of 9.21%. By comparison, VO has a 10-year CAGR of 9.50%, XMHQ has a 10-year CAGR of 11.49%, and SCHM has a 10-year CAGR of 8.89%. Of note, all of these mid-cap ETFs have underperformed the S&P 500 Index’s 10-year CAGR of over 12%. However, due to high returns from large and mega-cap stocks recently, mid-cap is comparatively undervalued. Additionally, the anticipated reduction of interest rates will make many mid-cap holdings an attractive category for investment this year.
10-Year Total Price Return: IJH and Compared Mid-Cap ETFs (Seeking Alpha)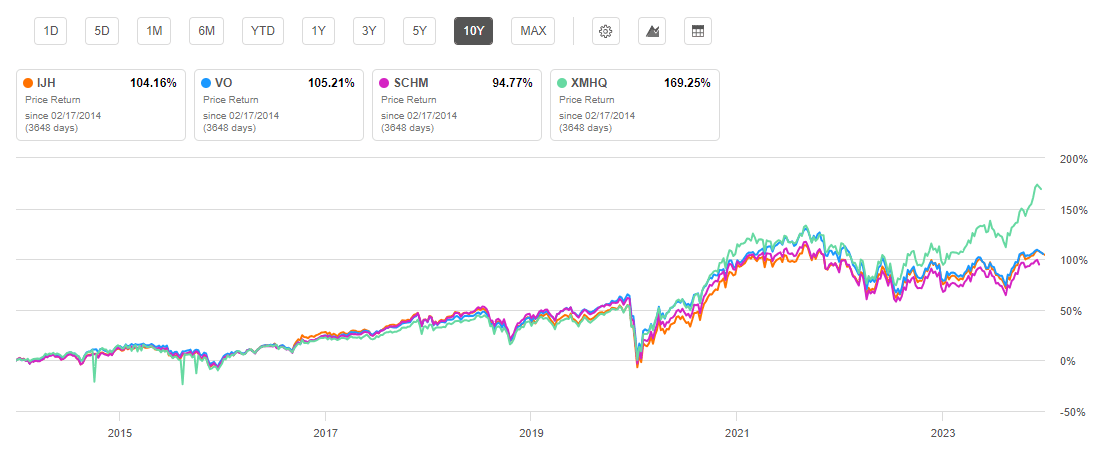
IJH has a very low expense ratio at just 0.05%. However, compared mid-cap funds, VO and SCHM, are even lower at 0.04%. IJH also has a noteworthy dividend yield at 1.43%. This is the highest of peer funds except for SCHM. Additionally, IJH’s dividend yield is growing with a 7.22% 5-year CAGR.
Expense Ratio, AUM, and Dividend Yield Comparison
|
IJH |
VO |
SCHM |
XMHQ |
|
|
Expense Ratio |
0.05% |
0.04% |
0.04% |
0.25% |
|
AUM |
$78.34B |
$152.91B |
$10.96B |
$3.59B |
|
Dividend Yield TTM |
1.43% |
1.16% |
1.48% |
0.66% |
|
Dividend Growth 5 YR CAGR |
7.22% |
1.54% |
8.56% |
-1.03% |
Source: Seeking Alpha, 13 Feb 24
IJH Holdings and Its Competitive Advantage
Due to the different objectives and tracked indexes of each of the compared mid-cap funds, their top holdings vary significantly. IJH, which is highly diversified with over 400 holdings, has only 7.1% weight on its top 10 holdings. By contrast, XMHQ with 81 holdings has 29.66% weight on its top 10 holdings.
Top 10 Holdings for IJH and Peer Mid-Cap ETFs
|
IJH – 405 holdings |
VO – 333 holdings |
SCHM – 499 holdings |
XMHQ – 81 holdings |
|
SMCI – 1.34% |
APH – 0.85% |
PINS – 0.60% |
SMCI – 6.11% |
|
DECK – 0.85% |
ANET – 0.84% |
VRT – 0.55% |
MANH – 3.93% |
|
RS – 0.67% |
TDG – 0.76% |
PTC – 0.54% |
DECK – 3.82% |
|
XTLSA – 0.66% |
CTAS – 0.75% |
DELL – 0.54% |
WSM – 2.75% |
|
CSL – 0.66% |
MSI – 0.75% |
DECK – 0.54% |
RS – 2.62% |
|
GDDY – 0.62% |
PCAR – 0.73% |
DKNG – 0.50% |
CSL – 2.50% |
|
MANH – 0.60% |
WELL – 0.72% |
CBOE – 0.49% |
WMS – 2.05% |
|
SAIA – 0.59% |
MCHP – 0.70% |
HUBB – 0.48% |
WSO – 1.98% |
|
GGG – 0.58% |
AJG – 0.70% |
STLD – 0.48% |
GGG – 1.96% |
|
LII – 0.57% |
CARR – 0.69% |
AXON – 0.48% |
RNR – 1.94% |
Source: Multiple, compiled by author on 12 Feb 24
All ETF investors know that a fund’s future performance is tied to the returns of its individual holdings. Key holdings that represent distinct differences for the ETF are Deckers Outdoor Corporation (DECK), Super Micro Computer, Inc. (SMCI), and GoDaddy Inc. (GDDY). Each of these holdings represents advantages due to the qualities discussed in further detail below.
SMCI – High Performance Servers with Strong Growth and Momentum
The first difference representing an advantage for IJH is Super Micro Computers. This IT company develops high performance servers and storage products and has seen an astounding 750% one-year price return. While IJH’s top holding, SMCI unfortunately only carries 1.34% weight due to the fund’s broad diversification. Super Micro Computers has seen tremendous…
Read More: IJH ETF: Attractively Valued Fund To Capture Mid-Cap Growth Potential