
Debt-ceiling drama pushed bond yields up last week, taking mortgage rates to a new 2023 high in the middle of the spring home-selling season. Active housing inventory, thankfully, saw some decent growth last week. Purchase application data had a second straight week of declines.
Here’s a quick rundown of the last week:
- Active inventory grew 8,914 week to week, even though new listing data is still trending at all-time lows in 2023.
- Mortgage rates rose to a 2023 year high of 7.12% as the debt ceiling talks pushed bond yields higher.
- Purchase application data had its second straight week of negative data as the constant theme of higher rates impacted the weekly data.
The 10-year yield and mortgage rates
The White House and Republicans announced a tentative deal on the debt ceiling on Saturday, putting an end to the drama we’ve all had to deal with for the past two weeks.
And on Wall Street, many traders were short the bond market, meaning that a lot of speculative trades were made betting that bond yields would quickly go higher. These two factors sent bond yields shooting up.
Of course, this sent mortgage rates to the yearly high of 7.12% last week, which is the second time this year that mortgage rates have made a 1% move higher from the bottom!
Mortgage rates have been very volatile — even though the 10-year yield hasn’t reached a new high in 2023, mortgage rates have. Since the banking crisis started, the mortgage market has gotten increasingly stressed, and the recent debt ceiling issues didn’t help. As you can see below, this last move higher in bond yields was very sharp.

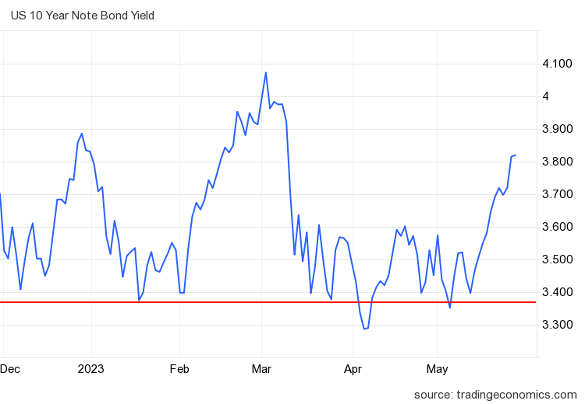
In my 2023 forecast, I wrote that if the economy stays firm, the 10-year yield range should be between 3.21% and 4.25%, equating to mortgage rates between 5.75% and 7.25%. I have also stressed that the 10-year level between 3.37% and 3.42% would be hard to break lower. I call it the Gandalf line in the sand: “You shall not pass.” So far in 2023, that line has held up, as the red line in the chart above shows.
However, even though we haven’t hit my peak mortgage rate call of 7.25%, the mortgage market is much more stressed than I thought it would be in 2023.
This is where the banking crisis and the debt ceiling uncertainty kick in, as I tagged the peak rate of 7.25% with a 10-year yield of 4.25%. The new variable of the banking crisis is important: the debt ceiling issue for now is over unless something unforeseen happens, but the banking crisis and the mortgage stress are still here.
We might get some short-term reprieve in bond yields and mortgage stress. However, the spreads between the 10-year yield and 30-year mortgage rates have worsened since the banking crisis started. It will be critical to see how the bond market and mortgage spreads act this week.
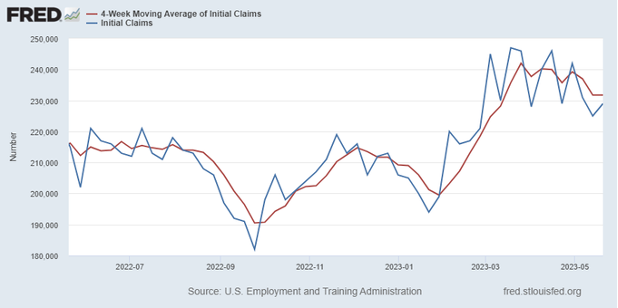
Another aspect of my 2023 forecast was that if jobless claims break over 323,000 on the four-week moving average, the 10-year yield could break under 3.21% and head toward 2.73%. This could push mortgage rates down into the mid-5% level. Right now, the jobless claims data, while rising noticeably from the recent lows, still hasn’t come close to breaking over 323,000 on the four-week moving average. This week is jobs week, with four different labor reports I’ll be watching.
From the St. Louis Fed: Initial claims for unemployment insurance benefits increased by 4,000 in the week ended May 20, to 229,000. The four-week moving average was little changed, at 231,750.

Weekly housing inventory
The growth in active listing inventory has been tepid this year. Some feared a mortgage rate lockdown would prevent inventory from growing this spring, but that’s not the case.
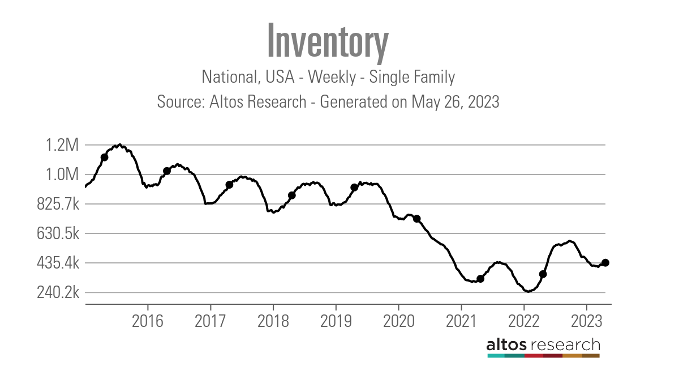
Even though inventory growth has been slow, we are still seeing a spring inventory bump as we do each year; it just hasn’t been very strong. As we can see from the data below, inventory is higher than last year but far from anything we think is normal.
- Weekly inventory change (May 19-26): Inventory rose from 424,190 to 433,104
- Same week last year (May 20-27): Inventory rose from 338,399 to 357,582
- The inventory bottom for 2022 was 240,194
- The peak for 2023 so far is 472,680
- For context, active listings for this week in 2015 were 1,131,405

New listing data rose last week, according to Altos Research, but the trend of 2023 having the lowest new listing growth in history is still intact. Even so, let’s remember that there are still people selling homes where they had low mortgage rates to buy homes in a higher rate environment: Total active listings are still higher this year than last.
Here are the new listings data for this week over the last several years:
- 2023: 62,765
- 2022:…