
sankai
Month in review
- Gold in US$/oz returned just 0.1% in April, consolidating after a strong run-up during Q1.
- Support for gold came from lower rates and positive ETF flows while lower inflation expectations and profit taking created a drag.
Looking forward
- The strong run-up y-t-d has left gold in need of a catalyst to break beyond its all-time high: one likely contender is a sharp equity correction, as valuations remain lofty in the face of deteriorating fundamentals.
- Gold’s performance during sharp equity corrections has almost always been positive but has varied quite a bit in magnitude; prior gold returns and the level of real interest rates are key factors.
- At current levels, these two factors suggest gold’s response to a sharp equity sell-off could sit in the upper end of the historical range.
Weaker momentum and lower yields compete
Gold rose by just 0.1% in April, to US$1,983/oz,1 as the March banking crisis – which had propelled gold sharply higher – abated and drove some profit-taking (Table 1).
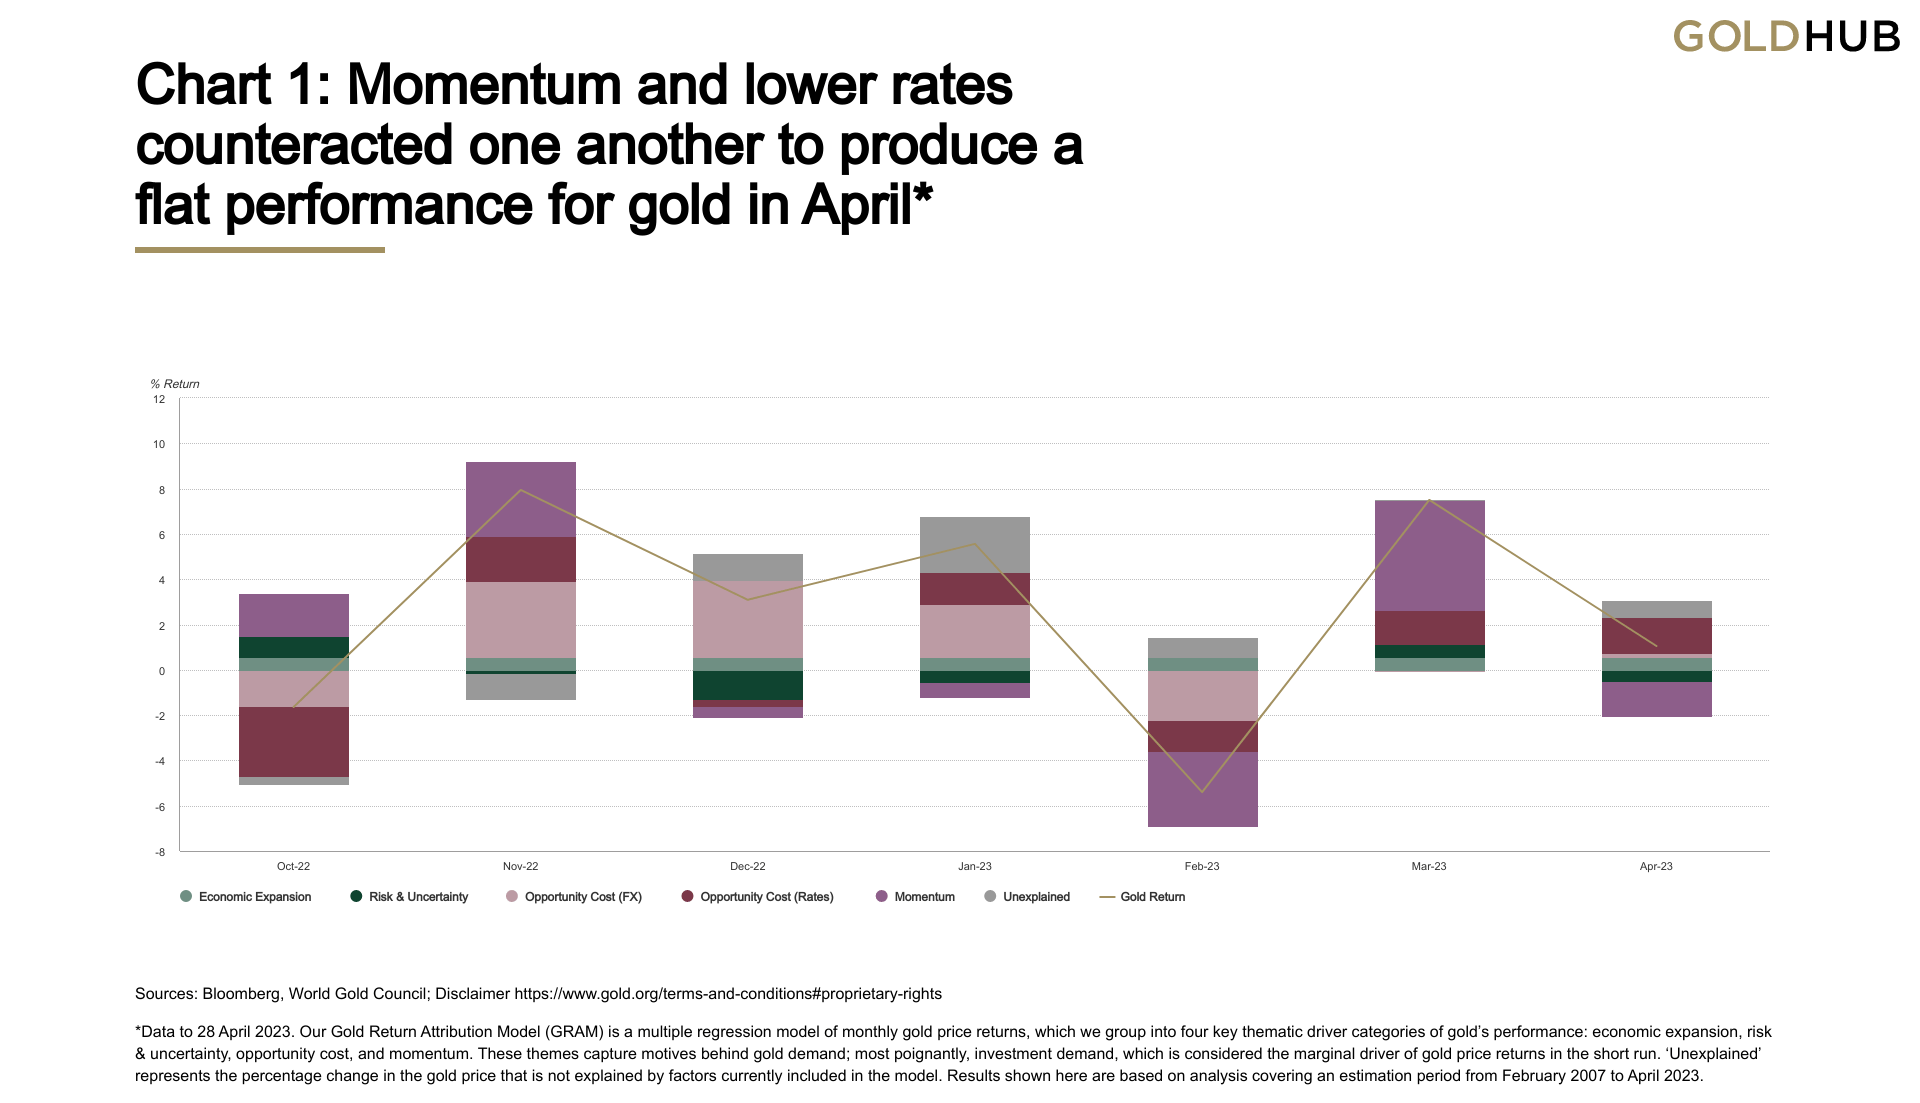
Our Gold Return Attribution Model (GRAM) indicates that April’s performance was negatively affected by the high return in March as the incipient banking crisis appeared to be well contained (Chart 1). A slight pullback in inflation expectations proved an additional drag.
In contrast, a drop in long-term Treasury yields on softer economic data provided some support and we note that another positive residual may point to continued central bank activity.
In addition, global gold ETFs experienced another month of inflows, mostly into US funds. European gold ETFs saw negligible outflows; a somewhat sanguine development given the weakness we saw for 10 months prior to March. COMEX futures followed suit, increasing longs by a modest 9 tonnes following a very strong March.
Chart 1: Momentum and lower rates counteracted one another to produce a flat performance for gold in April*
Sources: Bloomberg, World Gold Council; Disclaimer
*Data to 28 April 2023. Our Gold Return Attribution Model (GRAM) is a multiple regression model of monthly gold price returns, which we group into four key thematic driver categories of gold’s performance: economic expansion, risk & uncertainty, opportunity cost, and momentum. These themes capture motives behind gold demand; most poignantly, investment demand, which is considered the marginal driver of gold price returns in the short run. ‘Unexplained’ represents the percentage change in the gold price that is not explained by factors currently included in the model. Results shown here are based on analysis covering an estimation period from February 2007 to April 2023.
Table 1: Gold returns were mixed in April, consolidating just below all-time highs in US dollars
Gold price and return in different periods across key currencies*
| USD (oz) | EUR (oz) | JPY (g) | GBP (oz) | CAD (oz) | CHF (oz) | INR (10g) | RMB (g) | TRY (oz) | AUD (oz) | |
| 28 April 2023 price | 1,983 | 1,799 | 8,688 | 1,578 | 2,687 | 1,774 | 52,161 | 441 | 38,564 | 2,997 |
| April return | 0.1% | -1.5% | 2.7% | -1.7% | 0.4% | -2.1% | -0.3% | 0.8% | 1.6% | 1.2% |
| Y-t-d Return | 9.3% | 6.2% | 13.6% | 5.1% | 9.3% | 5.8% | 8.1% | 9.6% | 13.6% | 12.6% |
*Data to 28 April 2023. Based on the LBMA Gold Price PM in local currencies.
Source: Bloomberg, ICE Benchmark Administration, World Gold Council
Gradually… then suddenly
- Equities continue to grind higher even as recession risks mount; one of the tailwinds, excess savings, may be nearing depletion.
- Historically, gold has gone up during most sharp equity sell-offs but the magnitude varies: gold’s performance leading up to the sell-off and the prevailing level of real yields appear to be key.
- At current levels, these two factors suggest gold’s response to a sharp equity sell-off could be at the higher end of the historical range.
Equity markets are not the economy. But they are closely linked to it and stocks are a crucial investor sentiment barometer. If we go by their recent performance and valuations, sentiment seems pretty positive.
Yet, bonds and commodities appear to disagree. These assets have been signalling a recession or thereabouts since around mid-2022: bonds via a yield curve inversion and commodities via a lacklustre response to supply issues.2 Economists are increasingly of the same view: those from The Wall Street Journal see a 61% probability of a recession this year;3 Bloomberg’s economists put the probability at 65%;4 and the survey of Professional Forecasters predicts a 40% chance. Before you say: ‘40% is low’, consider that it is substantially higher than it was at the onset of the last five recessions.
Why are equities the lone wolf? There are a number of candidates to provide an explanation:
- Growth and employment is holding up despite soft data pointing to a sharp slowdown.
- The Fed…
Read More: Gold Market Commentary: Gold Rally Takes A Breather In April