
Yesterday the market centered around two significant events that impacted the USD and broader financial markets and we opened 17 forex signals. The Consumer Price Index (CPI) report came in below expectations, with the core CPI at +0.16% (unrounded) compared to an expected +0.3%. This weaker-than-expected inflation data led to a sharp decline in the US dollar.

The USD experienced widespread selling, with notable declines against currencies like JPY, EUR, and commodity dollars. Equities, particularly tech stocks, surged to record highs amid expectations that the Fed would adopt a more dovish stance, sending the NASDAQ and S&P 500 to new record highs. Contrary to market expectations, the Federal Open Market Committee (FOMC) revealed a dot plot indicating only one rate cut this year, whereas markets had priced in two cuts following the CPI disappointment.
Jerome Powell emphasized a data-dependent approach, noting that the Fed’s decisions hinge on economic data. He did not provide a strong signal suggesting a rate cut in September, disappointing markets expecting clearer dovish signals. The US dollar staged a recovery, reclaiming a significant portion of its earlier losses. USD/JPY, for instance, rebounded to 156.85 from lows around 155.75, reflecting a recovery of approximately 110 pips. Equity markets retraced some of their gains as well, but remained elevated compared to pre-CPI levels.
Today’s Market Expectations
Today the day started with the May employment figures from Australia. In May, Australia’s unemployment rate held steady at 4.0%, matching expectations and unchanged from April’s rate of 4.1%. The participation rate for May was 66.8%, slightly exceeding the forecast of 66.7%, with April’s rate also at 66.7%. Employment change for May showed an increase of 30,500 jobs, below the expected 38,500. The underemployment rate remained at 6.7%, while the underutilization rate was 10.7%. Monthly hours worked decreased to 1,951 million.
US Producer Price Index (PPI):
- Predictions:
- PPI YoY: Expected at 2.2%, steady from the prior year.
- PPI MoM: Expected at 0.2%, down from 0.5% in the previous year.
- Core PPI YoY: Expected at 2.3%, down slightly from 2.4% last year.
- Core PPI MoM: Expected at 0.2%, down from 0.5% in the previous year.
Market Impact:
- Limited Impact Expected: Given the significant attention already placed on the CPI and FOMC decisions, the PPI data is likely to have a muted impact on the markets. The key market drivers will have already set the tone, with the PPI figures reinforcing or slightly adjusting the existing sentiment rather than causing major shifts.
The weekly Jobless Claims report remains crucial as it offers a real-time indication of labor market conditions. Despite predictions of a slight increase in Initial Claims to 227K from 229K, and potentially stable Continuing Claims around 1792K, the market’s reaction to these figures may be muted compared to previous releases.
Yesterday the volatility picked up, with the USD tumbling more than 100 pips lower after the soft CPI inflation, while reversing course toward the end of the day after the hawkish FED. So, the price action was both ways and we did play both sides, opening 17 trading signals in total and ending up with 10 winning forex signals and four losing ones.
Mas Continue to Keep Gold Confined
Gold’s recent price movement shows its importance as a hedge against economic instability and inflationary pressures. While a higher US currency and encouraging economic statistics may momentarily reduce investor interest in gold, the metal’s long-term worth as a safe haven asset remains unchanged. The rebound from the 200 SMA suggests that buyers are still interested in purchasing gold at the $2,300 level, implying underlying support for the precious metal. Yesterday we saw a jump to $2,341.66 after the CPI numbers, but the 100 SMA (green) stopped the climb on the H4 chart and it eventually reversed lower.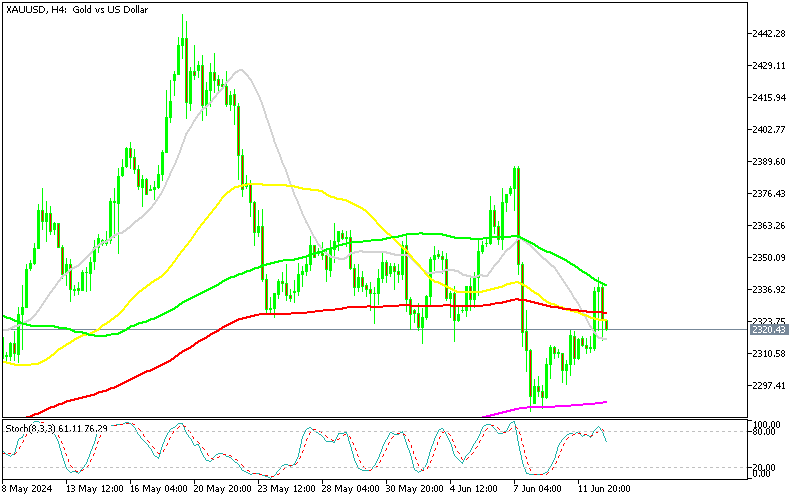
XAU/USD – H4 chart
The 50 Daily SMA Keeps USD/JPY Bullish
The USD/JPY pair demonstrated resilience early last week, finding robust support near the 50-day Simple Moving Average (SMA). This moving average has consistently acted as a reliable cue for buyers to enter the market, with repeated bounces underscoring its significance as a long-term dynamic support level. The recovery off the 50-day SMA last week was notable, culminating in a substantial 200-pip surge on Friday. This surge propelled the price above the critical 157 level, signaling robust buying momentum and reaffirming the dominance of buyers in the market.
Cryptocurrency Update
The Jump Fails in Bitcoin
Despite Bitcoin’s long-term uptrend remains intact, as seen by its ability to maintain above the 100-day Simple Moving Average (green), a critical support sign, we are in…
Read More: Forex Signals Brief June 13: Will PPI Send the USD Around Today?