
Quantitative Tightening has removed 38% of Treasury securities and 27% of MBS that pandemic QE had added.
By Wolf Richter for WOLF STREET.
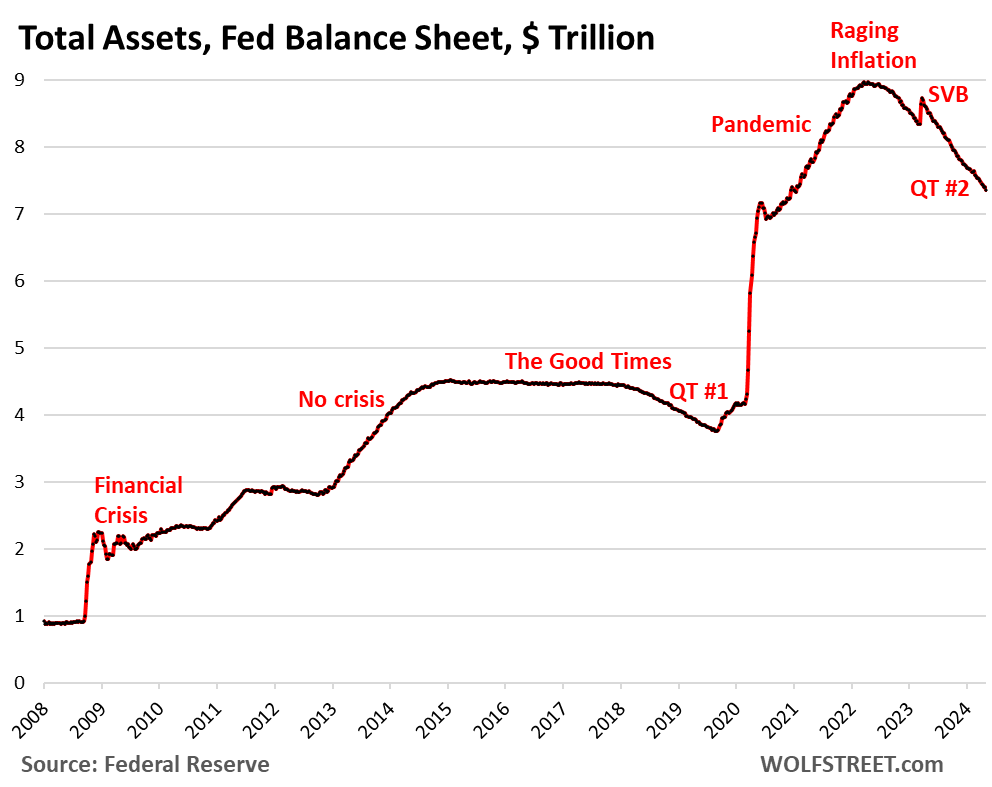
Total assets on the Fed’s balance sheet fell by $77 billion in April, to $7.36 trillion, the lowest since December 2020, according to the Fed’s weekly balance sheet today. Since the end of QE in April 2022, the Fed has shed $1.60 trillion.
After months of talking about it, the Fed has now clarified officially when, how, and by how much it will slow QT. They’re trying to get the balance sheet down as far as possible without blowing anything up, and easy will do it, that’s the hope.
- Starts in June
- Cap for Treasury runoff reduced to $25 billion from $60 billion
- Cap for MBS runoff unchanged at $35 billion
- If MBS run off faster than $35 billion a month, then the excess will be replaced with Treasury securities, and not MBS.
- MBS to essentially vanish from the balance sheet over the “longer term.”
QT by category.
Treasury securities: -$57 billion in April, -$1.25 trillion from peak in June 2022, to $4.52 trillion, the lowest since October 2020.
The Fed has now shed 38% of the $3.27 trillion in Treasury securities that it had added during pandemic QE.
Treasury notes (2- to 10-year securities) and Treasury bonds (20- & 30-year securities) “roll off” the balance sheet mid-month and at the end of the month when they mature and the Fed gets paid face value. The roll-off is capped at $60 billion per month, and about that much has been rolling off, minus the inflation protection the Fed earns on Treasury Inflation Protected Securities (TIPS) which is added to the principal of the TIPS.

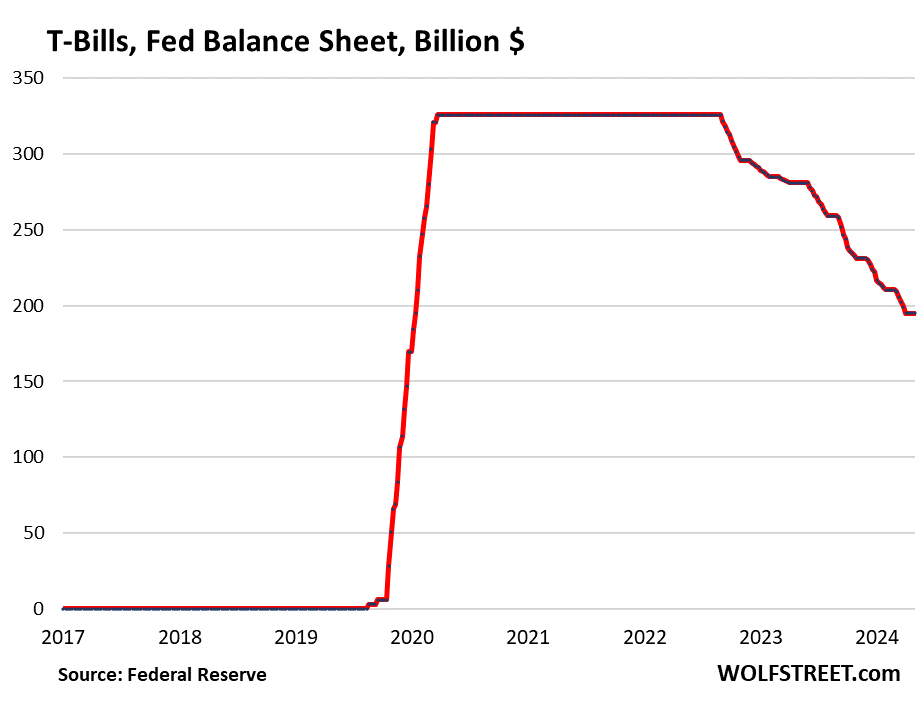
Treasury bills. Unchanged in April at $195 billion. These securities with terms of up to 1 year are included in the $4.52 trillion of Treasury securities on the Fed’s balance sheet. But they play a special role in QT.
The Fed lets them roll off (doesn’t replace them when they mature) only if not enough longer-term Treasury securities mature to get to the $60-billion monthly cap. This allowed the Fed shed about $60 billion in Treasury securities every month.
From March 2020 through the ramp-up of QT, the Fed held $326 billion in T-bills that it constantly replaced as they matured (flat line in the chart below).
The slower QT starting in June will follow the same principle with T-bills. But the first month with a Treasury roll-off below the new cap of $25 billion is September 2025 ($17 billion). So T-bills will stay on the balance sheet unchanged at $195 billion until then, even as notes and bonds come off:
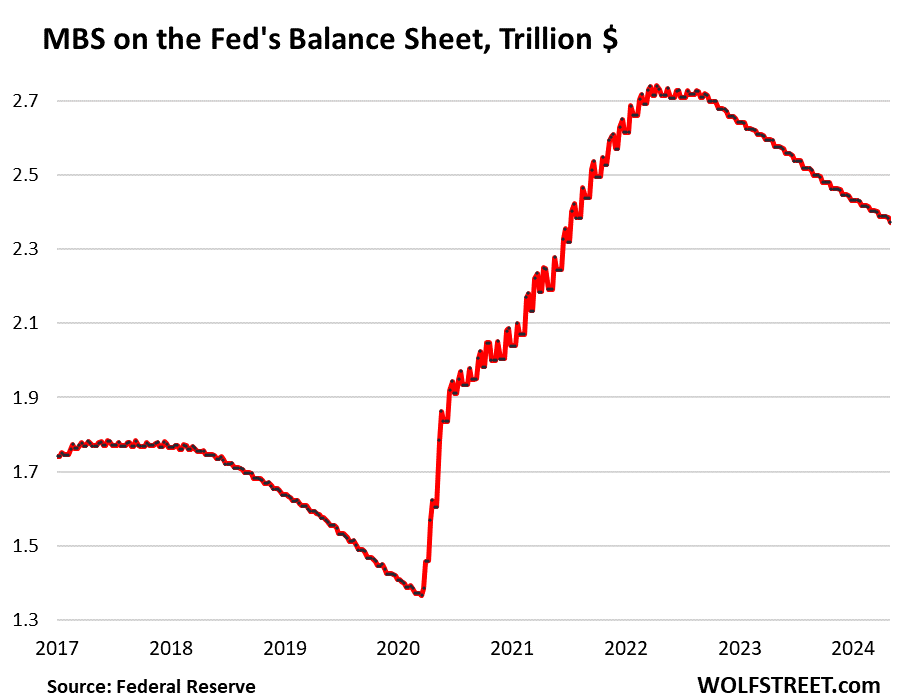
Mortgage-Backed Securities (MBS): -$16 billion in April, -$368 billion from the peak, to $2.37 trillion, the lowest since July 2021. The Fed has shed 27% of the MBS it had added during pandemic QE.
MBS come off the balance sheet primarily via pass-through principal payments that holders receive when mortgages are paid off (mortgaged homes are sold, mortgages are refinanced) and when mortgage payments are made.
But sales of existing homes have plunged, and mortgage refinancing has collapsed, and so fewer mortgages got paid off, and passthrough principal payments to MBS holders, such as the Fed, have been reduced to a trickle, and the MBS are coming off the balance sheet at a pace that’s far below the $35-billion cap.
Under the slower QT starting in June, the MBS cap remains at $35 billion. When the housing market unfreezes, and sales volume rises to more normal-ish levels, mortgage payoffs will increase, and therefore passthrough principal payments to MBS holders will increase, and the MBS roll-off will increase from current levels, and the curve in the chart below will steepen.
If pass-through principal payments exceed $35 billion – during the pandemic housing boom, they exceeded $110 billion in many months – the overage will be replaced with Treasury securities, not MBS, as the Fed wants to phase out the MBS on its balance sheet.
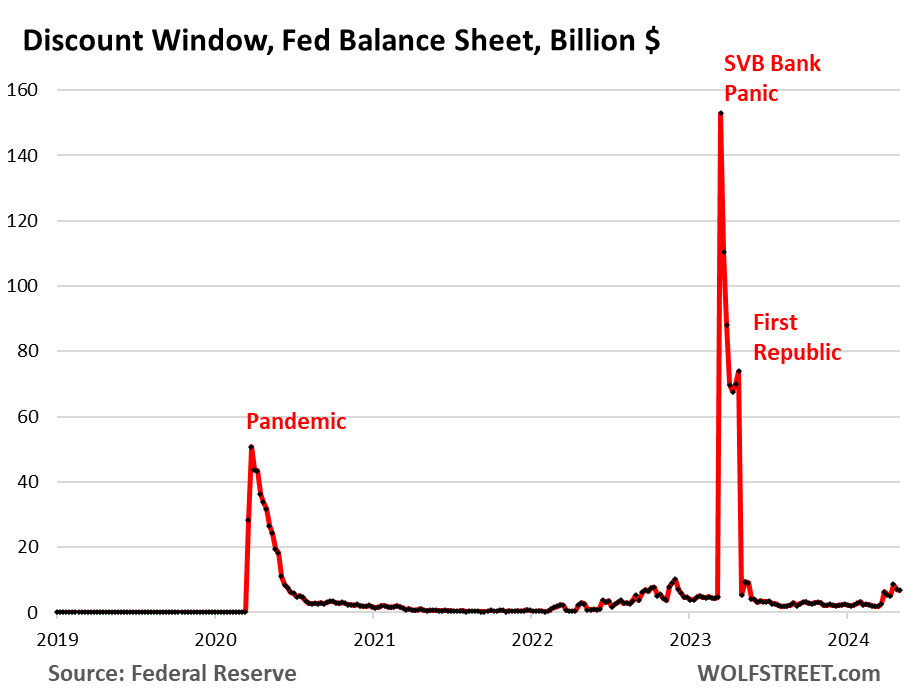
Bank liquidity facilities.
Discount Window: +$1.3 billion in April, to $6.8 billion. During the bank panic in March 2023, loans had briefly spiked to $153 billion.
The Discount Window is the Fed’s classic liquidity supply to banks. The Fed currently charges banks 5.5% in interest on these loans – one of its five policy rates – and demands collateral at market value, which is expensive money for banks, and there’s a stigma attached to borrowing at the Discount Window, and so banks don’t use this facility unless they need to, though the Fed has been exhorting them to make more regular use of this facility.
Bank Term Funding Program (BTFP): -$6.4 billion in April, to $124 billion.
Cobbled together over a panicky weekend in March 2023 after SVB had failed, the BTFP had a fatal flaw: Its rate was based on a market…
Read More: Fed Balance Sheet QT: -$1.60 Trillion from Peak, to $7.36 Trillion, Lowest since