
Simulation of airflow velocity field in vortex generator
We conducted a simulation to analyze the airflow velocity field within the vortex generator. In order to prevent interference from the roadway airflow with the formation of the vortex pneumatic fog curtain during the actual operation of the device, it was necessary to set a higher wind speed for the pneumatic fog curtain. Based on the actual working conditions and the stable long-term operation capability of the centrifugal fan, we set the inlet wind speed to 12 m/s. Figure 9 illustrates the velocity distribution of the simulated airflow in different sections of the vortex generator, with the gradient zone on the right side of the numerical simulation chart representing the velocity. As depicted in Fig. 9, the inlet speed of 12 m/s results in an outlet wind speed of 30 m/s. Figure 10 presents the external wind flow field of the vortex generator.

Velocity distribution of air duct.

External air flow field of the device.
As observed in the visual representation, the vortex airflow projects forward in a vortex-shaped manner, and its range progressively expands, gradually shaping a rotating wind curtain. This closely mirrors what was observed during the experimental phase. Figure 10 reveals that the airflow diminishes rapidly once it escapes through the 32 slits of the louvers. Within a distance of 0.3 m, the airflow velocity decreases to 1.2 m per second, and at 0.8 m, a minimal amount of airflow is directed along the x-axis.
Exit velocity simulation of vortex pneumatic fog screen
We conducted a simulation to analyze the outlet velocity of the vortex pneumatic fog screen. In this simulation, the section boundary type for the airflow entering the calculation area was set as a velocity inlet, while the outlet was designated as a pressure outlet. The nozzle was positioned along the positive x-axis direction, and the particle type was specified as liquid drops, with water as the material and a spray pressure of 8 MPa.
As depicted in Fig. 11, the device’s outlet velocity progressively transforms into a vortex-like fog screen once it surpasses 10 m/s. Furthermore, it is evident that the thickness of the vortex spray ring diminishes as wind speed increases. However, the cross-sectional area expands, resulting in greater spray coverage. It’s important to highlight that for enhanced dust capture efficiency, it is advantageous to have a higher spray speed, allowing fog droplets to collide more vigorously with dust particles. Based on practical considerations, it was observed that when the airflow velocity of the vortex spray head reaches 35 m/s, it generates increased vibrations in the airflow channel. To ensure the device’s long-term operational stability, an outlet velocity of 30 m/s has been defined as the optimal wind speed for this device. Two exit velocities were examined: 10 m/s and 30 m/s.
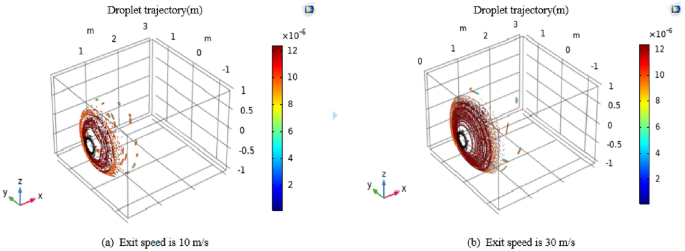
Droplet trajectory diagram at exit velocities of 10 m/s and 30 m/s.
Simulation of droplet particle field in vortex pneumatic fog screen
Following the adjustment of nozzle angles, we conducted simulations to observe the droplet particle spray process and obtain information regarding the range of droplet sizes and fog screen coverage. For these simulations, we maintained a wind speed of 30 m/s and an initial spray velocity of 30 m/s. Three nozzle angles, specifically 60°, 75°, and 90°, were chosen for the simulation. The results of the droplet particle field simulations for these three nozzle angles are presented in Figs. 12, 13 and 14. The numerical simulation charts include a gradient band on the right side to indicate the droplet sizes.

Trajectory diagram of vortex spray particles at nozzle angle of 60°

Trajectory diagram of vortex spray particles at nozzle angle of 75°

Trajectory diagram of vortex spray particles at nozzle angle of 90°
As illustrated in Figs. 12, 13 and 14, when the nozzles are installed at a 60° angle, the mist curtain moves forward in a circular shape with a diameter of 2.6 m, and the effective spray distance is 0.4 m, 20 s post-initiation. The droplet sizes range from 3 to 12 μm. Notably, the atomization effect of droplets produced by the vortex generator surpasses that of traditional high-pressure spraying. As the spray distance increases, the droplet size gradually decreases, with most droplets disappearing beyond a 0.4-m spray distance. Conversely, when the nozzles are set to a 75° angle, the effective spray distance remains at 0.4 m, with the mist curtain advancing in a circular shape with a diameter of 2.6 m, and droplet sizes roughly between 3 and 12 μm. At a spray distance of 0.2 m, the droplet diameter is approximately 12 microns. Beyond a spray distance of…
Read More: Experimental and numerical evaluation of the dust suppression efficiency of an