
pidjoe
The BlackRock Utilities, Infrastructure & Power Opportunities Trust (NYSE:BUI) is a closed-end fund that aims to deliver high current income and capital appreciation to unitholders. The fund holds a balanced portfolio of defensive utility stocks and offensive industrial and technology companies that work surprisingly well together to deliver 5Yr average annual returns of 9.5%. The fund’s generous 6.2% distribution yield is well supported by historical total returns. I believe the BUI fund is definitely worth considering for income-oriented investors that also want a bit of growth. I rate the BUI fund a buy.
Fund Overview
The BlackRock Utilities, Infrastructure & Power Opportunities Trust is a closed-end fund (“CEF”) that aims to provide total returns to investors via a combination of current income and capital appreciation. The fund primarily invests in equity securities of companies in the Utilities, Infrastructure, and Power businesses and utilize an option writing strategy to enhance income. As of March 31, 2023, the fund has written options on approximately 1/3 of the portfolio (Figure 1).
Figure 1 – BUI write call options on 1/3 of portfolio (blackrock.com)
The fund manager combines a portfolio of defensive utility and infrastructure stocks with offensive Power Opportunity companies. Power Opportunities include ancillary businesses involved in renewable energy, alternative fuels, energy efficiency, automotive and sustainable mobility technologies such as electrical equipment manufacturers (i.e. wind turbine manufacturers) and semiconductor and equipment companies (i.e. solar panel manufacturers).
The BUI fund has $520 million in net assets and charges a 1.08% net expense ratio.
Portfolio Holdings
The average market cap of BUI’s portfolio is $57 billion and the fund has 56 holdings in total. The BUI fund takes a global perspective in its investments with 58% of holdings based in the United States, 7% from France, 5% from Germany, 5% from Italy, and 4% from Portugal (Figure 2).
Figure 2 – BUI geographical allocation (blackrock.com)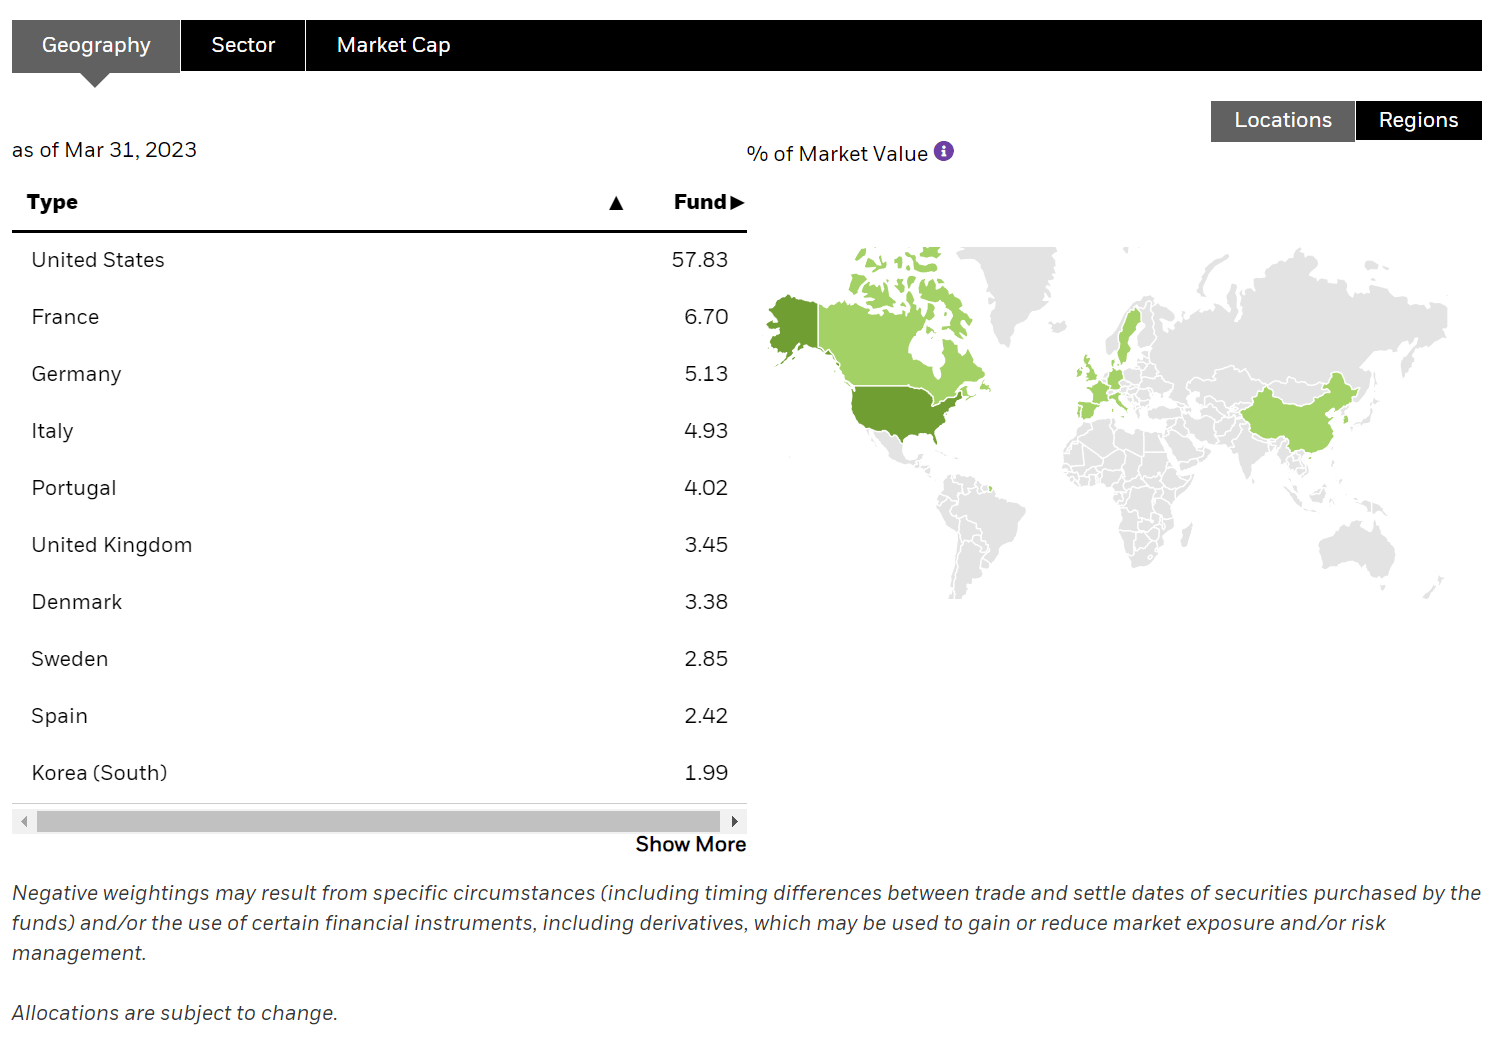
Figure 3 shows the fund’s sector allocation. Approximately half of the fund is allocated to Utilities, 20.7% in Capital Goods, 10.2% to Energy companies, and 5.3% to Commercial & Professional Services.
Figure 3 – BUI sector allocation (blackrock.com)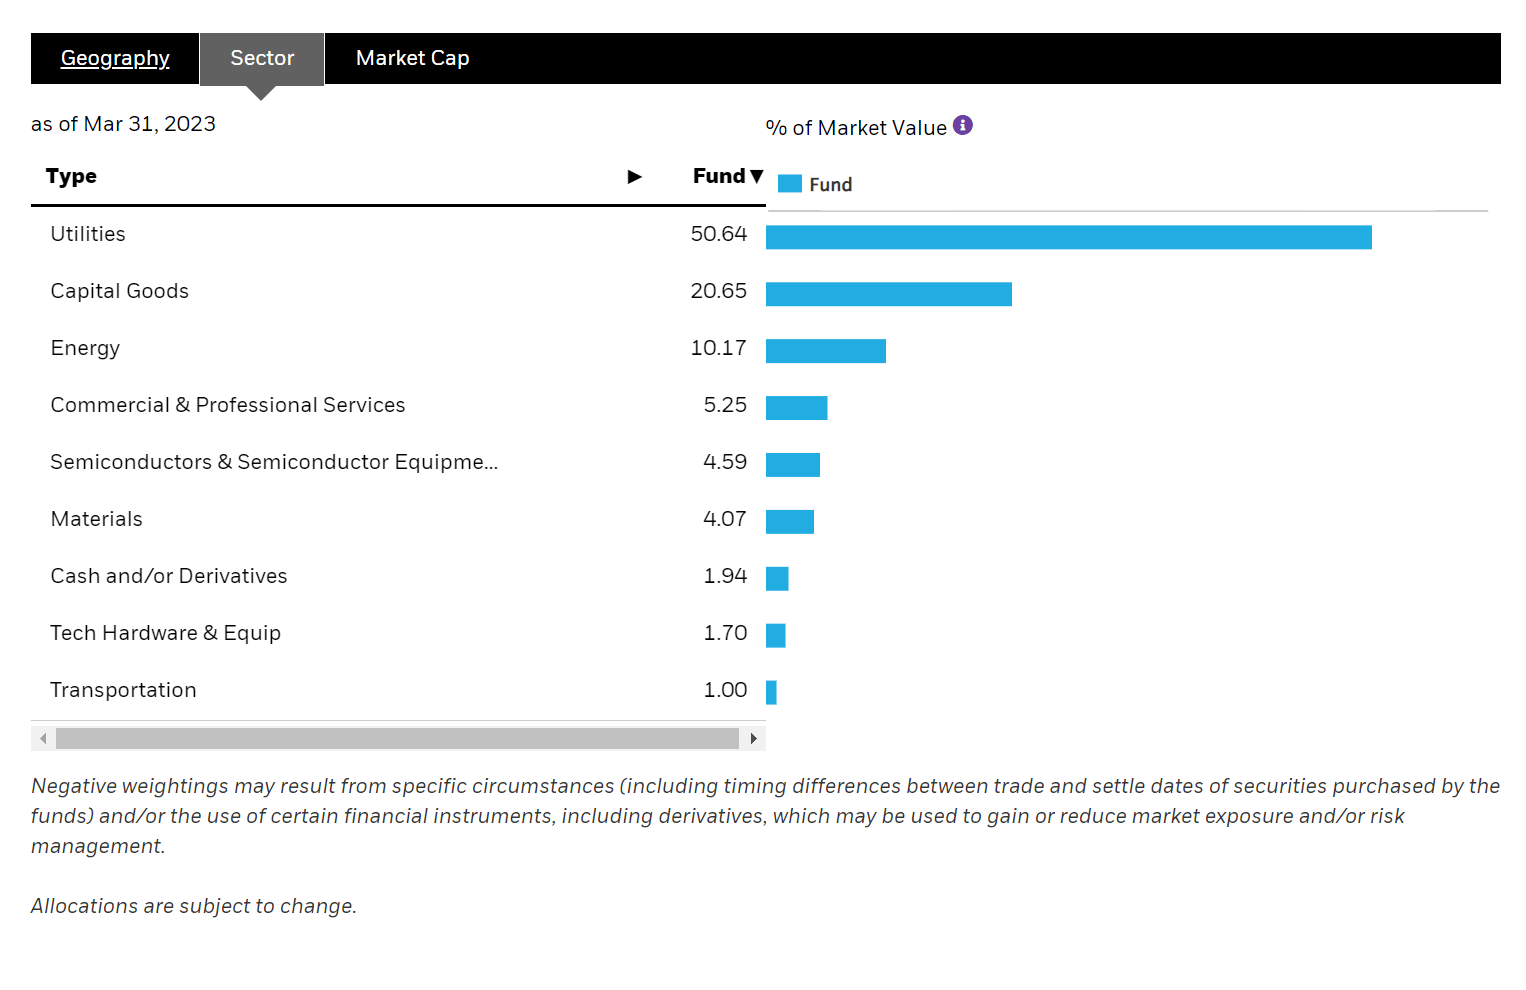
The fund’s top 10 holdings are shown in figure 4 and comprise 37.3% of the fund. BUI’s portfolio appears to be well diversified aside from the outsized 8.3% weight in NextEra Energy Inc. (NEE).
Figure 4 – BUI top 10 holdings (blackrock.com)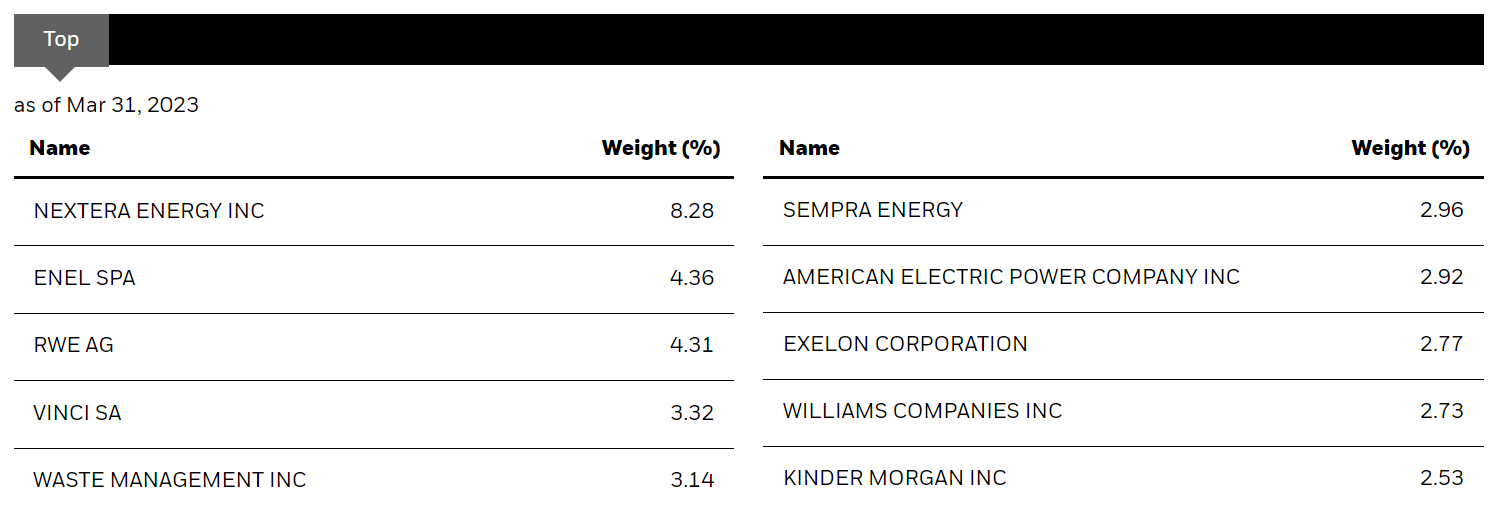
Solid Returns Over A Cycle…
Figure 5 shows the BUI fund’s historical returns. BUI has delivered solid long-term returns, with 3/5/10Yr average annual returns of 14.5%/9.5%/8.0% respectively to April 30, 2023.
Figure 5 – BUI historical returns (morningstar.com)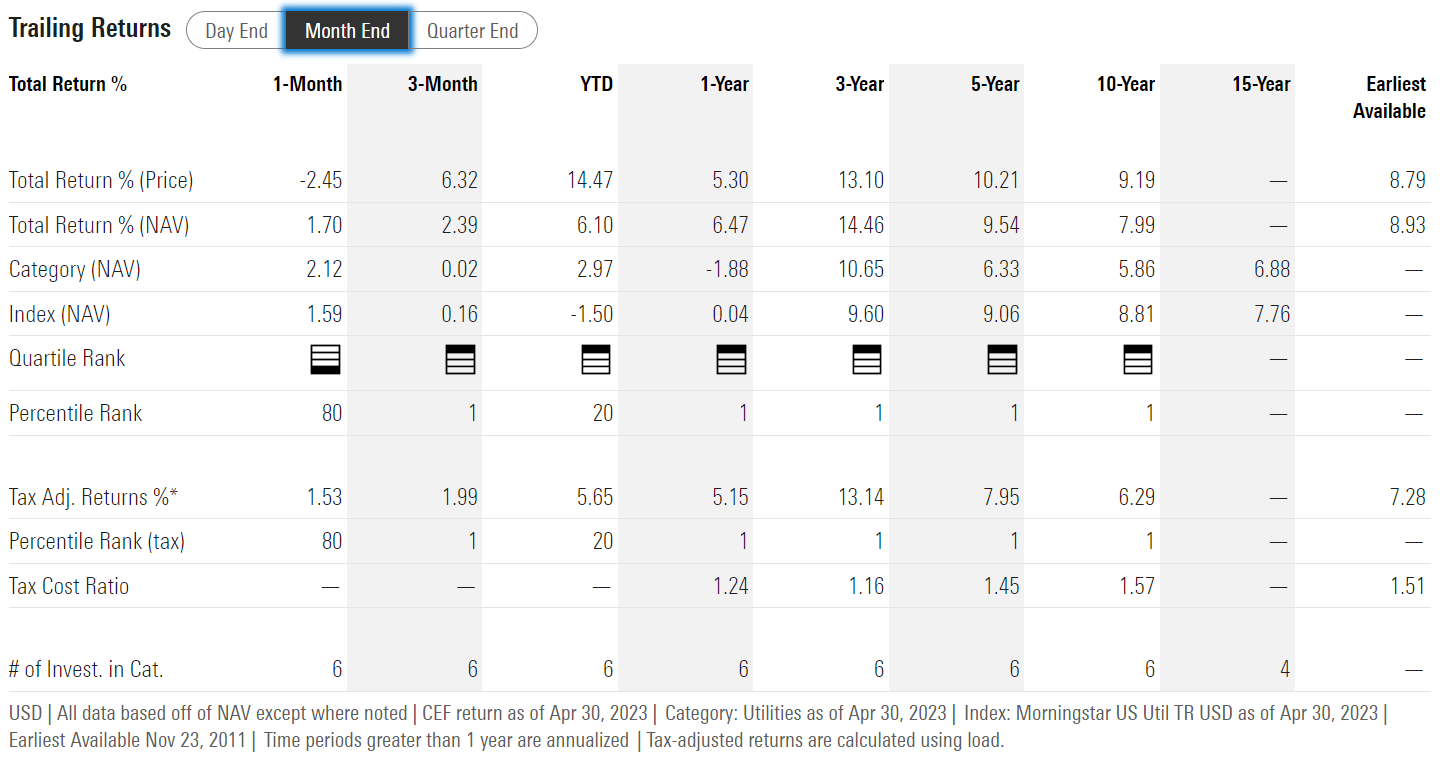
Note, the 3Yr return figure may be flattered by the starting period, April 2020, which was close to the COVID pandemic lows in the equity markets. However, the strategy’s overall returns appear to be capable of delivering high single digit (“HSD”) returns of 8 to 9% p.a. over a cycle.
…Backstopping Generous Distribution Yield
The fund’s HSD total returns over a cycle backstop a generous distribution yield, which has been maintained at $0.121 / month since 2015, yielding 6.2% on current market price. On NAV, the fund is yielding 6.3%.
The BUI fund’s distribution has been funded out of a combination of net investment income (“NII”), realized gains, and return of capital (“ROC”) (Figure 6).
Figure 6 – BUI has funded distributions from a combination of NII, realized gains, and ROC (BUI annual report)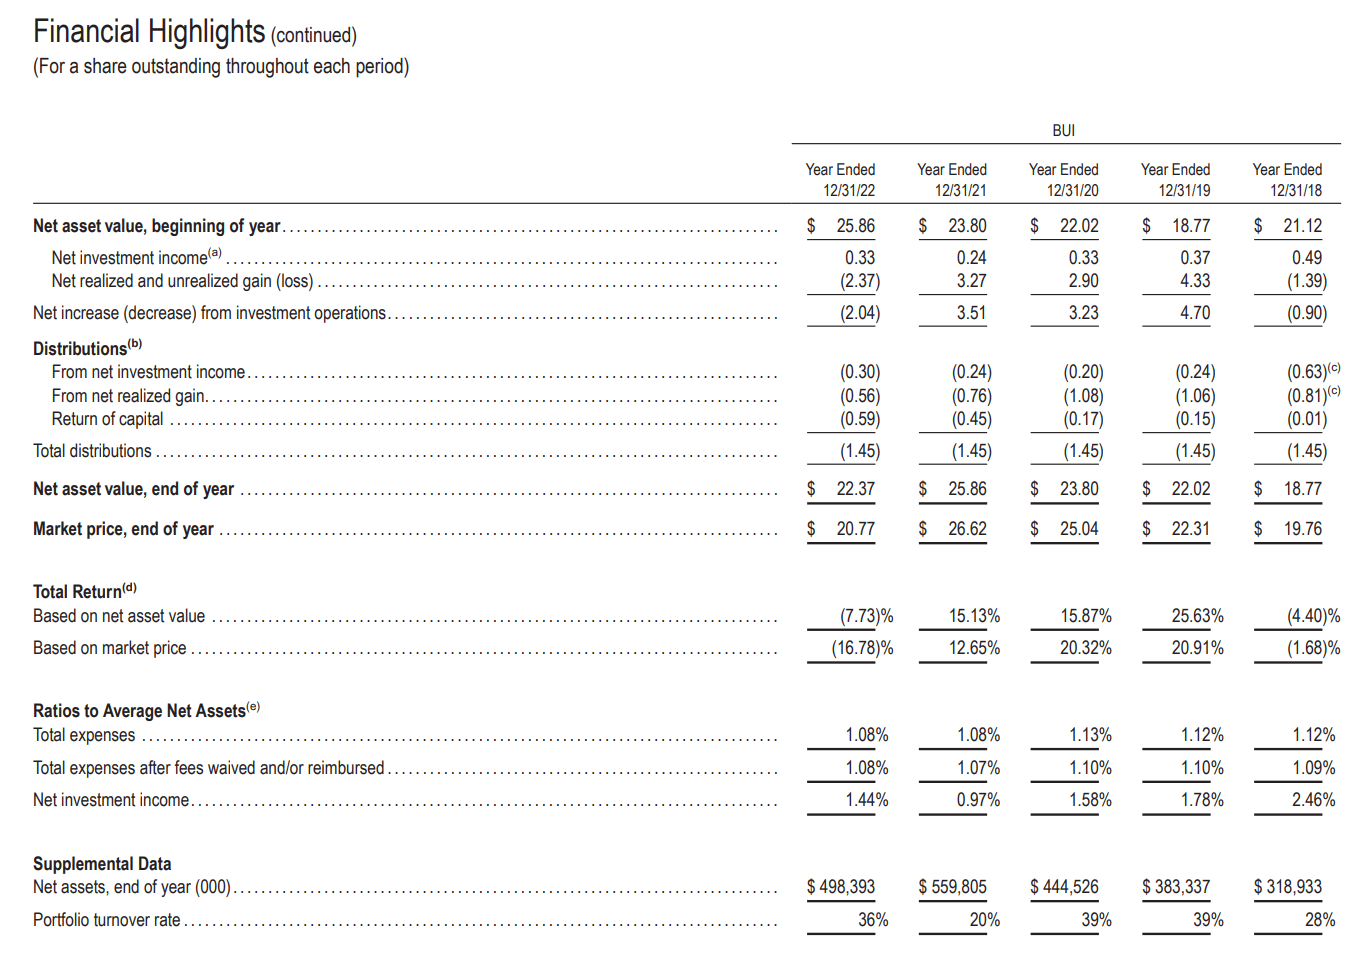
While the fund’s usage of ROC is relatively high, I am not too concerned that it is an amortizing ‘return of principal’ fund which liquidates NAV in order to fund distributions. This is because the fund’s historical returns of 9.5% p.a over 5 years and 8.0% p.a. over 10 years is more than sufficient to fund the fund’s distribution rate of 6.3% of NAV.
Another way to confirm my conclusion is to look at the BUI fund’s NAV, which shows a generally rising pattern that is not characteristic of ‘return of principal’ funds (Figure 7).
Figure 7 – BUI has a rising NAV profile (morningstar.com)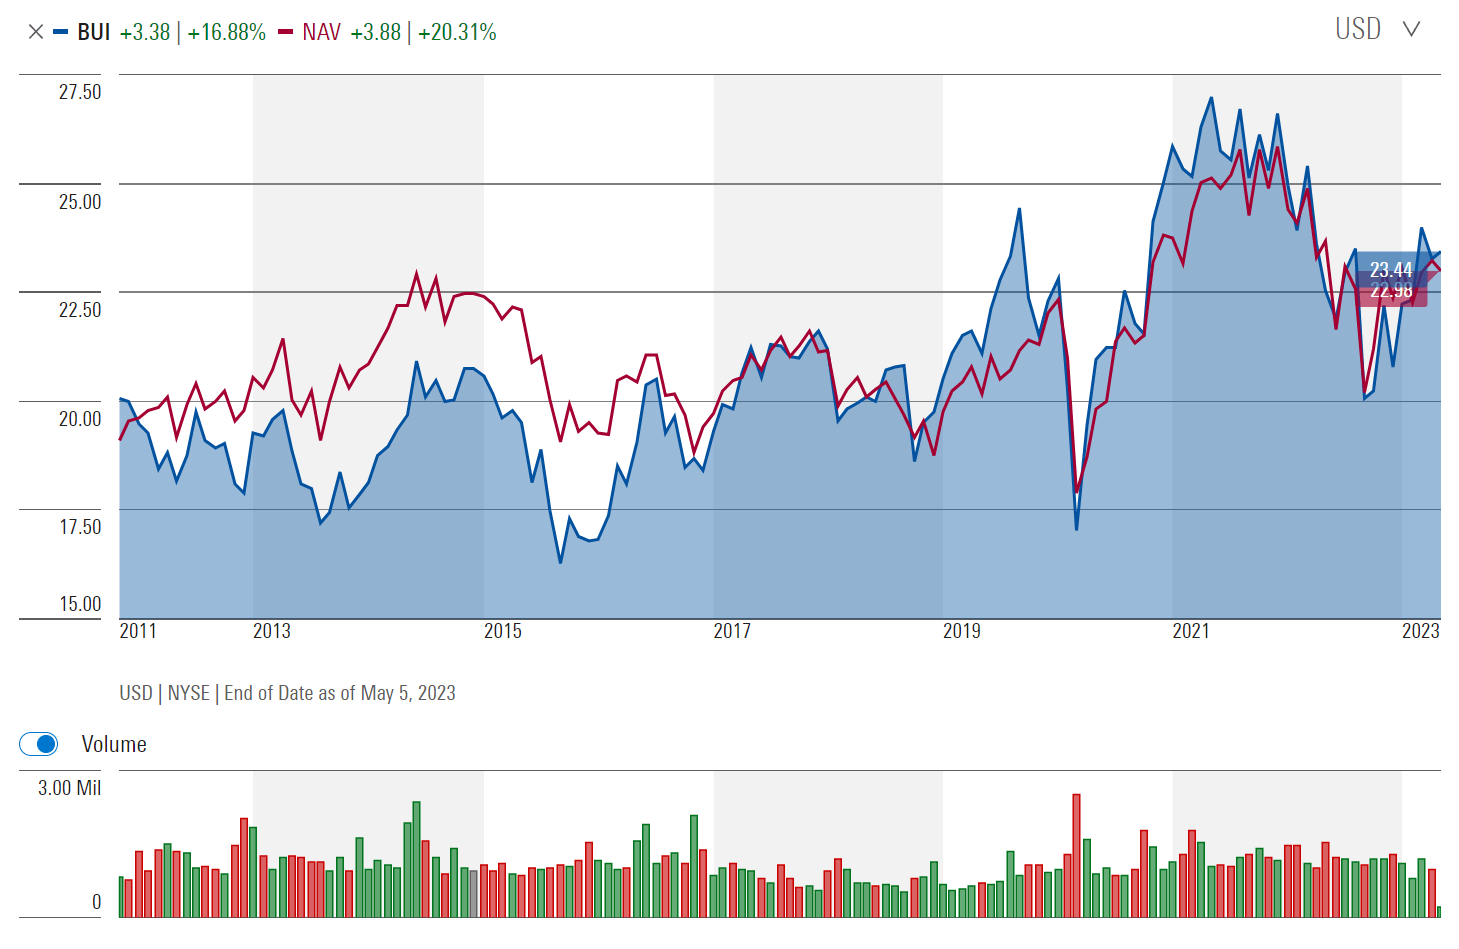
So although on a tax accounting basis, the BUI fund is not earning its distribution, as it consistently pays back investors’ capital through its distribution, economically, the BUI fund is creating value for unitholders.
BUI Vs. Peers
Figure compares the BUI fund against peer utility and infrastructure CEFs that I have covered in recent months including the Reaves Utility Income Trust (UTG), the DNP Select Income Fund (DNP) and the Cohen & Steers Infrastructure Fund (UTF).
Figure 8 – BUI vs. peers (Author created with data form Seeking Alpha and…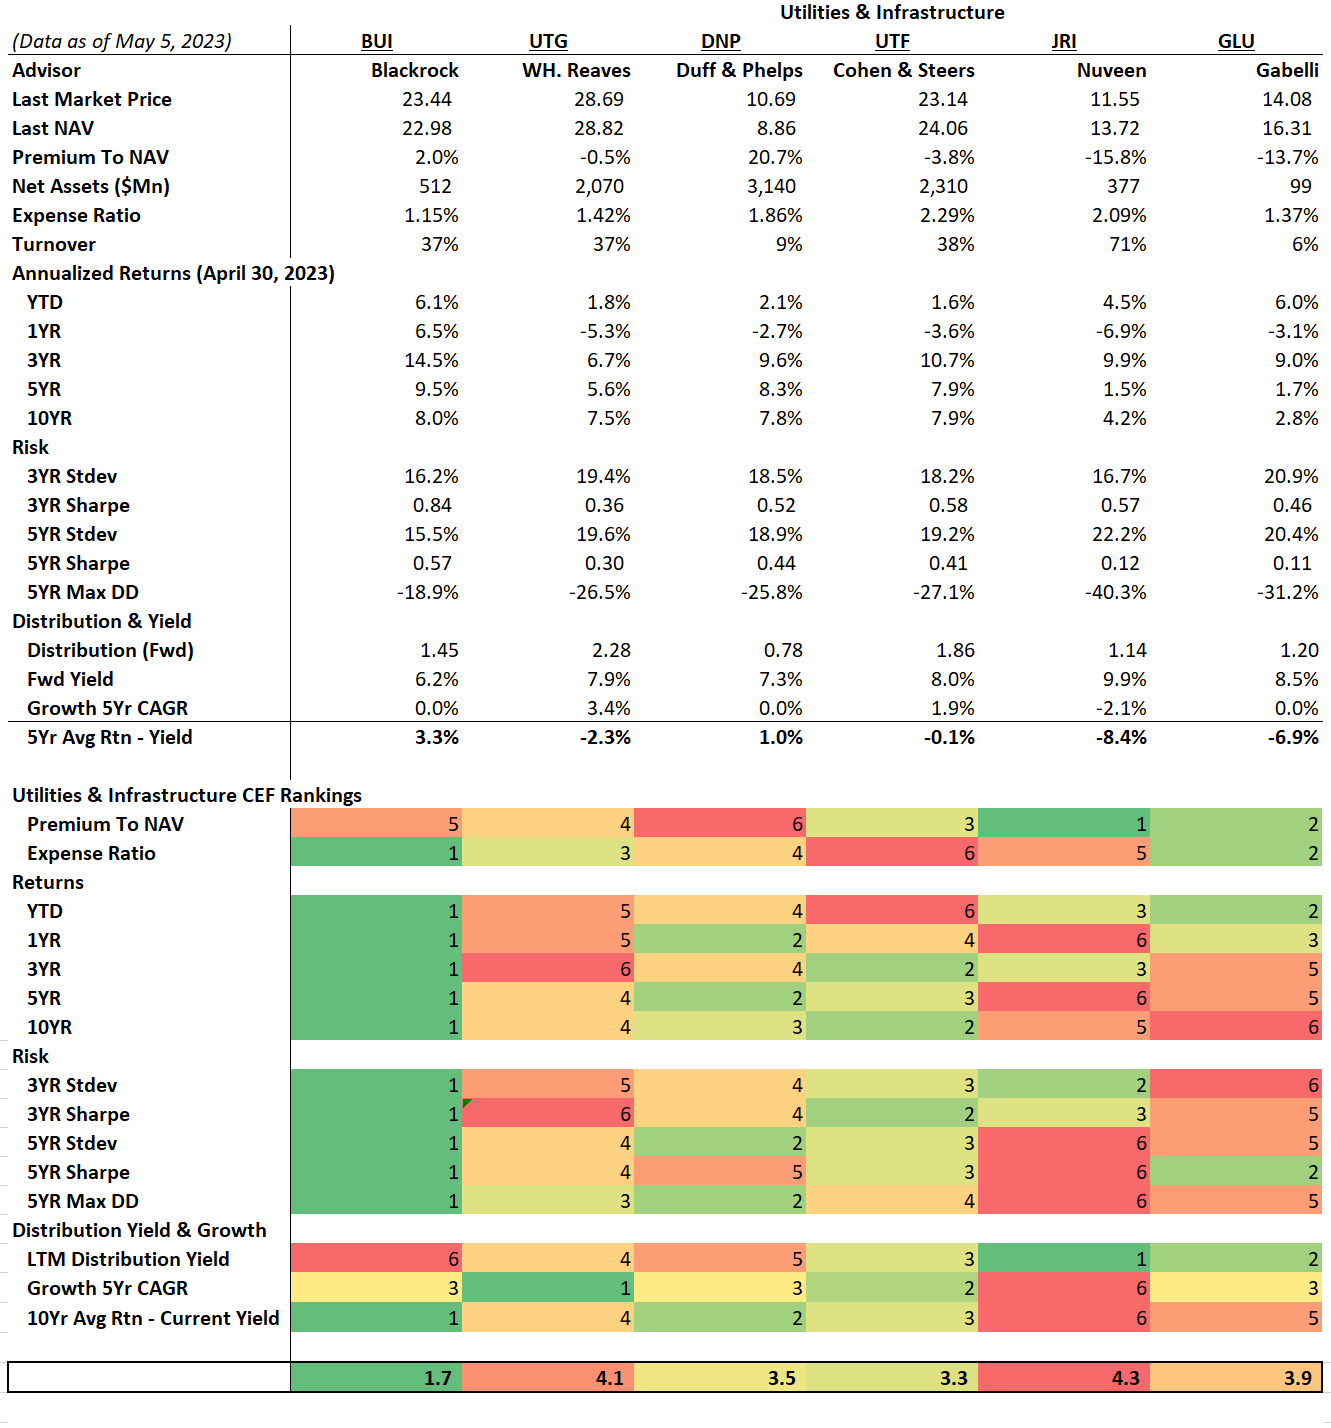
Read More: BUI CEF: Peer-Leading Utilities Fund Yielding 6.2%