
- Bitcoin price started a downside correction from the $30,000 zone against the US Dollar.
- The price is now trading above $28,000 and the 55 simple moving average (4 hours).
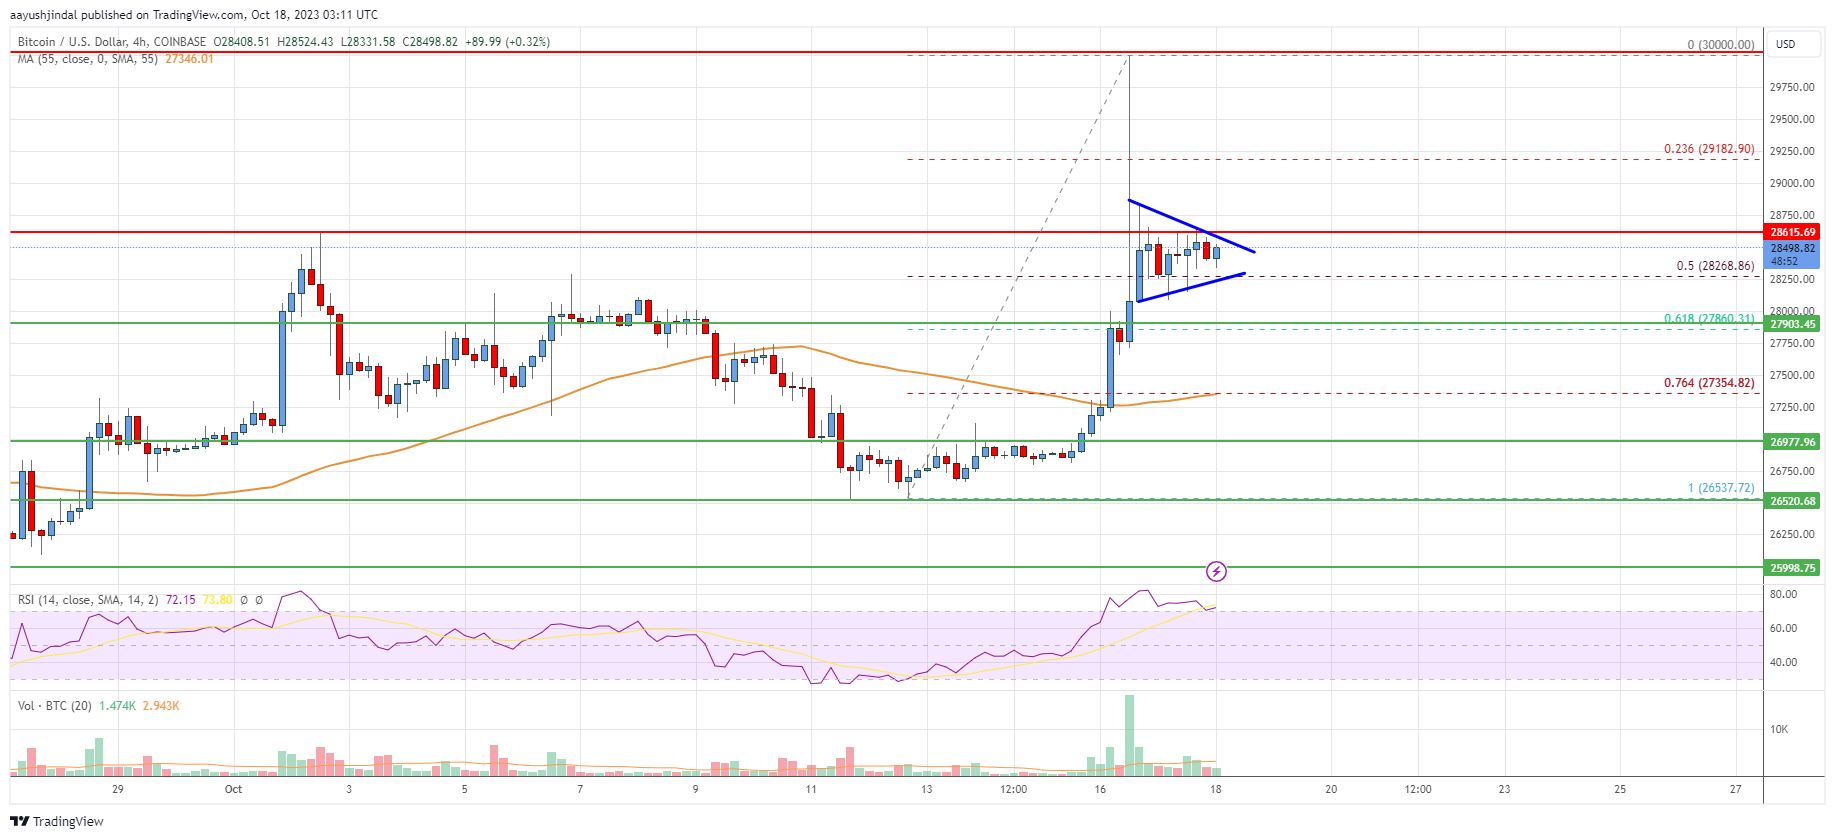
- There is a short-term contracting triangle with support near $28,250 on the 4-hour chart of the BTC/USD pair (data feed from Coinbase).
- The pair could start a fresh increase if it stays above the $27,750 support zone.
Bitcoin price is correcting lower below $28,750 against the US Dollar. BTC might eye another increase if the bulls remain active above the $27,750 zone.
Bitcoin Price Analysis
Bitcoin price gained pace after fake news of spot ETF approval and rallied toward the $30,000 resistance zone. A high was formed near $30,000 before the price started a downside correction. There was a clear move below the $28,800 and $28,650 levels.
The bears were able to push the price toward the 50% Fib retracement level of the upward move from the $26,537 swing low to the $30,000 high. It is now trading above $28,000 and the 55 simple moving average (4 hours).
However, the bulls are now active near the $28,200 support. There is also a short-term contracting triangle with support near $28,250 on the 4-hour chart of the BTC/USD pair. Immediate resistance on the upside is near the $28,600 level.
The next major resistance might be near the $28,800 zone. A clear move above the $28,800 level might send the price toward $29,500, above which the price might rise toward the $30,000 level. Any more gains might push the price toward the $32,000 zone.
If there is no upside break, the price might continue to decline below the $28,250 level. The first major support is $27,750 or the 61.8% Fib retracement level of the upward move from the $26,537 swing low to the $30,000 high. The next key support is near the $27,350 level, below which the price might accelerate lower.
In the stated case, the price could decline toward the $26,500 level. Any more losses might send the price toward the $26,000 level.
Looking at the chart, Bitcoin price is clearly trading above $28,000 and the 55 simple moving average (4 hours). Overall, the price could start a fresh increase if it stays above the $27,750 support zone.
Technical Indicators
4 hours MACD – The MACD is now losing momentum in the bearish zone.
4 hours RSI (Relative Strength Index) – The RSI is now above the 50 level.
Key Support Levels – $28,250 and $27,750.
Key Resistance Levels – $28,600, $28,800, and $30,000.
Read More: Bitcoin Price Analysis: BTC Rally Could Resume Above $28,800