
- Bitcoin’s aSOPR was at 1.03 at press time.
- As it approaches 1.08, the coin is at risk of a price decline.
Bitcoin’s [BTC] price might be due for a correction as the value of a key on-chain metric trends toward historically “dangerous” levels, CryptoQuant analyst Woo Minkyu found in a new report.
Minkyu assessed BTC’s Adjusted Spent Output Profit Ratio (aSOPR) using a 200-day moving average and found that its move toward 1.08 put the leading coin at risk of correction.
BTC’s aSOPR measures the profit or loss realized when the coin is spent by its holders. An aSOPR value above 1 signifies that coins are being sold at a profit overall.
Conversely, a value below 1 suggests that investors are selling at a loss.
As of this writing, the coin’s aSOPR was 1.03, meaning that BTC holders currently record profits from selling their coins.
AMBCrypto reported earlier that despite the significant resistance faced at the $71,000 price level, over 87% of BTC’s circulating supply is held in profit.
According to Minkyu, an increase in BTC’s aSOPR value toward 1.08 signals a potential risk of a price decline.
“However, historical data suggests that when this indicator approaches 1.08, Bitcoin prices tend to enter a correction phase. Considering past instances where similar patterns were observed, there is a possibility that the current situation might follow the same trend,” the analyst noted.
Bitcoin continues to trend within a range
At press time, BTC exchanged hands at $64,584. It has trended within a horizontal channel since 20th May, bouncing between resistance at $71,926 and support at $64,529.
A horizontal channel is formed when an asset’s price consolidates within a range for a period of time. This narrow oscillation occurs when a relative balance between buying and selling pressures prevents the price from trending strongly in either direction.
BTC’s declining Average True Range confirms the consolidation phase. AMBCrypto found that the value of this volatility marker has decreased by 28% since 20th May.
This indicator measures market volatility by calculating the average range between high and low prices over a specified number of periods.
When it falls, it suggests lower market volatility and hints that the asset’s price is trending within a range.
However, although BTC currently trends within a range, the market’s bearish influence is still significant. Readings from the coin’s Directional Movement Index (DMI) revealed this.
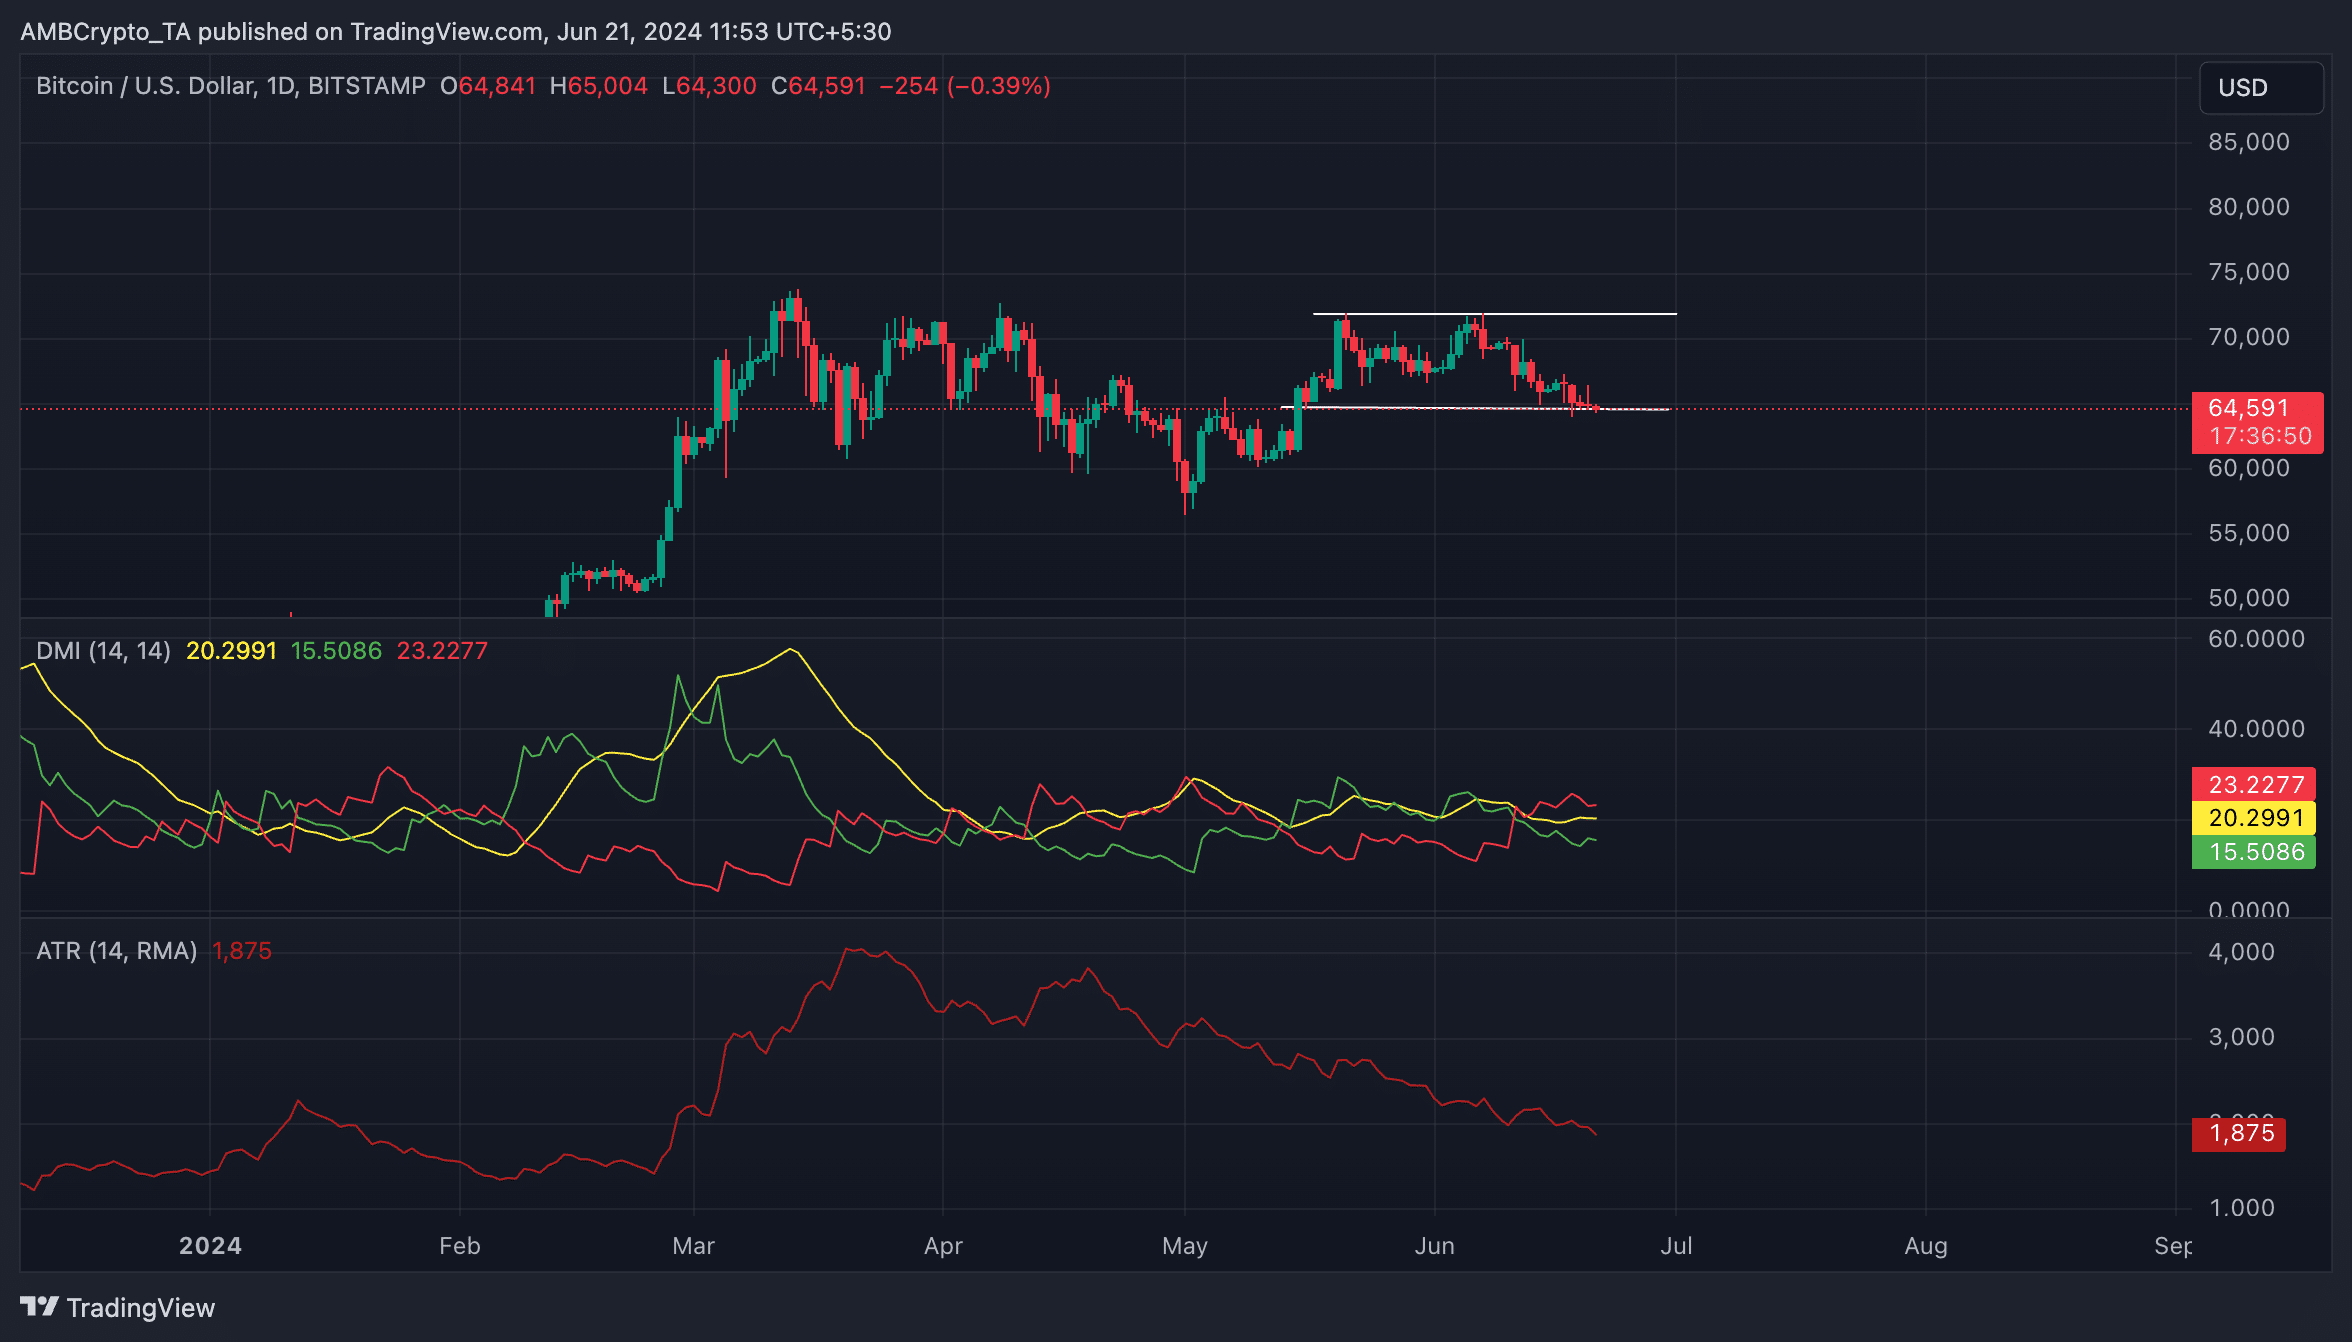
Source: TradingView
Read Bitcoin’s [BTC] Price Prediction 2024-25
As of this writing, the coin’s negative directional index (red) rested above its positive index (green).
An asset’s DMI measures the strength and direction of an asset’s price trend. When set up this way, it indicates that the bearish trend is stronger than the bullish trend. This suggests a higher likelihood of a downtrend compared to an uptrend.
Read More: Bitcoin at risk as key on-chain metric signals correction – What now?