

Bitcoin’s price plunged under the psychologically significant support level of $30,000 over the past week, reaching a close of $28,874 today.
The Federal Reserve’s decision to increase the rate by 25 bps on July 26 seems to have been largely shrugged off by Bitcoin, however.
As Bitcoin continues to consolidate, what are the best cryptos to buy now?
Additionally, the crypto market experienced a dull weekend, as it digested the disappointing figures released from the US Personal Consumption Expenditures (PCE) Index.
The Index fell short of the market’s forecasted figures, maintaining the subdued mood of crypto enthusiasts.
Bitcoin is exchanging hands at around $29,250, recording a daily trade volume of approximately $11.8 billion – a spike of 56.08% so far today.
Bitcoin has been showcasing a consolidated performance above the Fib 0.382 level at $29,137 over the past week. This level seems to be currently acting as immediate support.
Meanwhile, it is struggling against the 50-day Exponential Moving Average (EMA) which has stubbornly acted as a ceiling to the Bitcoin price, marking a current resistance point at $29,357.
Bitcoin’s RSI is hovering at 43.53, within the negative territory. An RSI under 50 suggests that sellers may be exerting more influence in the market.
However, as it is not drastically below 30 – which is often interpreted as an oversold condition – it also indicates that the market isn’t severely bearish.
Despite a mild 0.14% downturn so far today, Bitcoin maintains its hold above the immediate support level at $29,137.
However, given the resistance imposed by the 50-day EMA, coupled with the unfavorable RSI and the positioning of the 20-day EMA, there could be increasing downward pressure in the immediate future.
Investors should consider closely monitoring Bitcoin’s price performance against the 50-day EMA resistance.
If the resistance at the 50-day EMA remains unbreached, the possibility of Bitcoin revisiting the support at the Fibonacci 0.382 level, or even potentially falling toward the 100-day EMA, cannot be ruled out.
In contrast, a convincing breach of the 50-day EMA might signal a potential bullish reversal, possibly pushing the price toward the 20-day EMA.
Bitcoin is currently experiencing an exceptional period of stability, with its volatility at an all-time low.
Many believe that this is a clear indication of the highly-anticipated Bitcoin halving event that is expected to shake up the cryptocurrency market.
With their solid fundamentals and optimistic technical indicators, Optimism, Wall Street Memes, Compound, IOTA20, and Bitcoin Cash are some of the best cryptos to buy now.
Optimism (OP) Reaches 2-Month High: Is It Time to Invest?
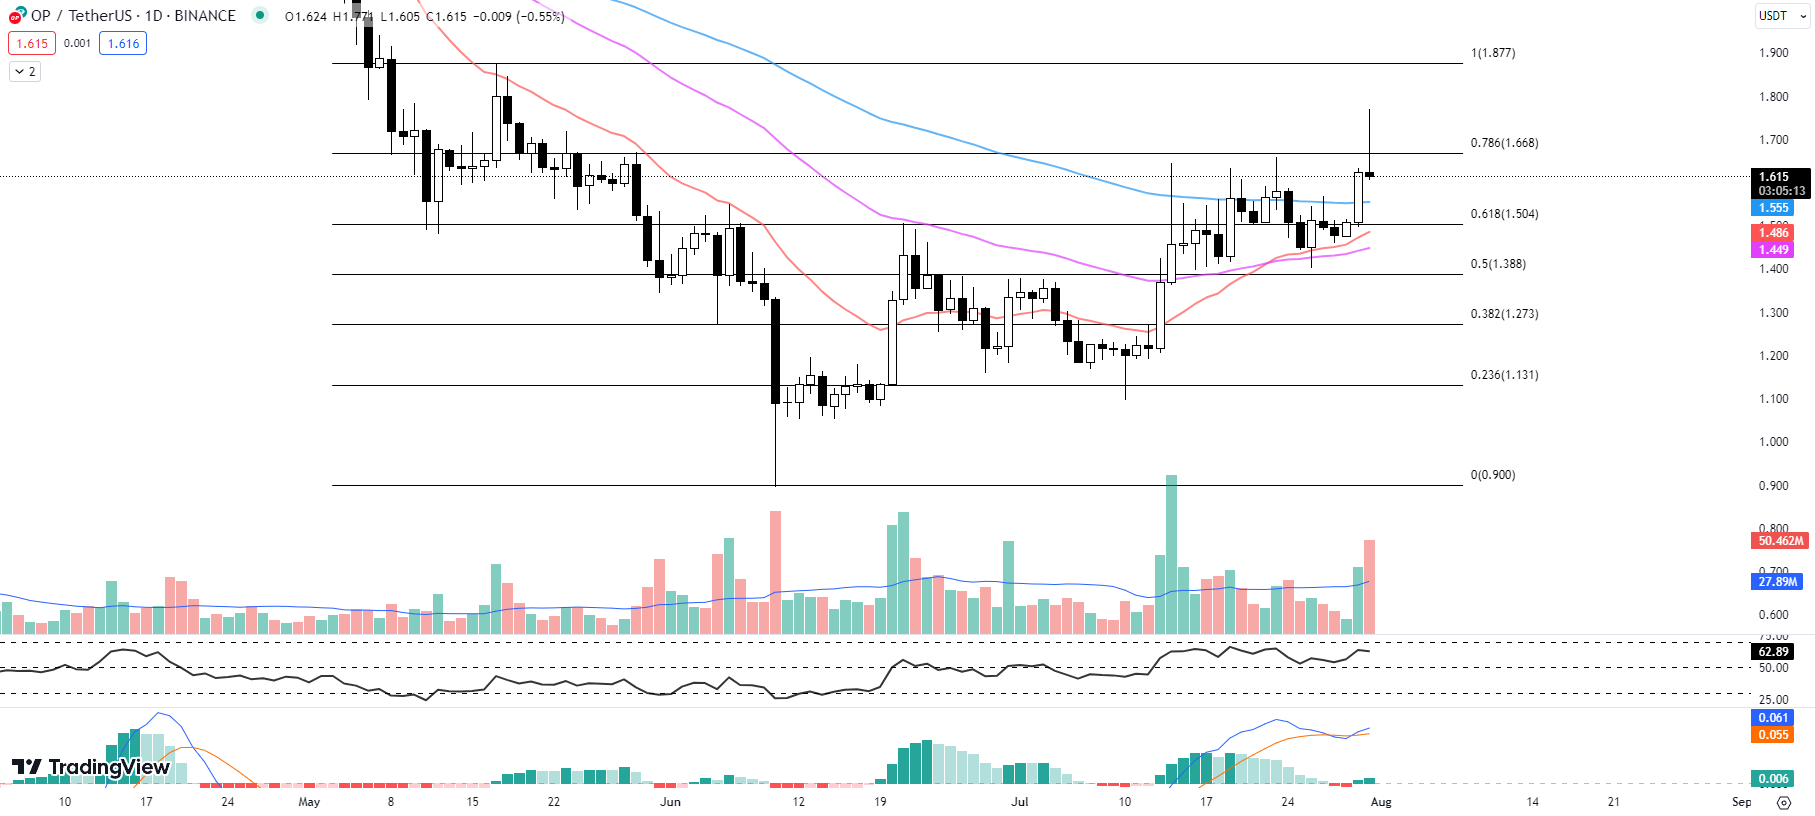
Observers of the market are captivated by the latest price action of Optimism (OP), which has taken an upward trajectory to reach a 2-month high of $1.771.
This bullish sentiment stems from the strong bounce of OP from the Fib 0.618 level at $1.504.
However, the momentum appears to have slowed down as OP faces resistance and undergoes a minor 0.55% price adjustment so far today to its current value of $1.615.
Taking a look at the technical indicators, the EMAs over 20, 50, and 100 days are currently $1.486, $1.449, and $1.555 respectively.
These figures suggest an overall bullish momentum, particularly with the current price sitting above all three EMAs.
The RSI currently sits at 62.89, slightly decreased from yesterday’s 63.78. This suggests a marginal cooling off from the recent bullish activity, yet it still signals moderate buying pressure.
The MACD histogram, another valuable tool for understanding price momentum, has also risen to 0.006 from yesterday’s 0.003, further corroborating the current bullish sentiment.
Despite this overall optimistic picture, it’s worth noting that the immediate resistance for OP lies at the Fib 0.786 level at $1.668.
While a breakthrough at this point would certainly signal a stronger bullish trend, investors should exercise caution given the recent selling pressure that pulled the price from its two-month high.
Meanwhile, the immediate support for OP lies at the 100-day EMA at $1.555, followed by the Fibonacci 0.618 level at $1.504.
These points serve as the safety nets in the event of a price drop and could be where OP may find some steadiness, should the selling pressure continue.
While Optimism (OP) has demonstrated substantial resilience and growth potential, the current technical indicators suggest that it may need to consolidate at the 100-day EMA before moving further.
FOMO No More: Wall Street Memes Presale Could Be the Best Crypto to Buy Now
Since its announcement on May 26, 2023, the Wall Street Memes presale has been the…
Read More: Best Crypto to Buy Now 31 July – Optimism, Compound, Bitcoin Cash