

onurdongel
Early Q3 was a nervous time for MLP companies, specifically gas producers and transporters in the Permian region. There were fears that NG production could overwhelm capacity for transportation, but even extreme heat in the ERCOT market did not seem to disrupt either production or midstream energy activities. The Alerian MLP ETF (NYSEARCA:AMLP) rests near its best levels on a total return basis since early 2015, outpacing the S&P 500 in the last three years, though underperforming the broad Energy Select Sector SPDR ETF (XLE).
I reiterate my buy rating on AMLP given its robust momentum, big yield, and still-decent fundamentals & valuation, though seasonal risks are a concern.
AMLP Outperforming SPX Last 3 Years, Near Multi-Year Total Return Highs
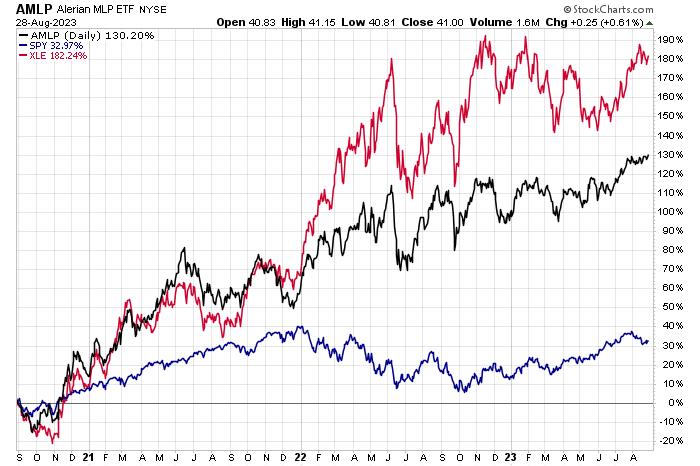
Stockcharts.com
According to the issuer, AMLP offers exposure to the Alerian MLP Infrastructure Index (AMZI), which comprises energy infrastructure Master Limited Partnerships (MLPs). These MLPs primarily earn their cash flow from midstream activities and are involved in owning and operating energy infrastructure assets like pipelines, storage facilities, and processing plants. These assets are crucial for connecting energy production to both local and global demand.
Due to their tax structure, MLPs can distribute a large share of their cash flow to investors, as they are not subject to entity-level taxes. Also, yield-hungry investors may prefer MLPs and real-asset exposure with significant cash flow generation, which can help mitigate inflation.
AMLP is a large ETF with close to $7 billion in assets under management as of August 28, 2023. Its forward dividend yield is high at 8.2%, though the fund is on the expensive side at 0.85% annually. Dividends peaked in 2015 at nearly $6 per share; today that figure stands at just $3.32 on a forward-looking yearly basis, which is up from a trough of $2.80 in 2021.
AMLP Dividend History, Payouts Back on the Rise
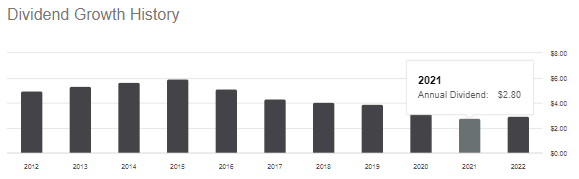
Seeking Alpha
Liquidity is strong with the ETF as evidenced by its 3-month average volume of 1.09 million shares while its 30-day median bid/ask spread is just two basis points. Expect volatility with AMLP given its high standard deviation of 25.92 and a beta slightly above 1.
Digging into the portfolio, the Morningstar Style Box illustrates that the fund has a big value orientation with significant small and mid-cap exposure. So, the holdings are particularly susceptible to swings in macroeconomic conditions, namely what happens with energy demand (not so much the price of oil, however). With a low-teens price-to-earnings ratio and a modest price-to-sales multiple, the fund is arguably on the cheap side and trades significantly under the P/E of the broader market.
AMLP: Portfolio & Factor Profiles
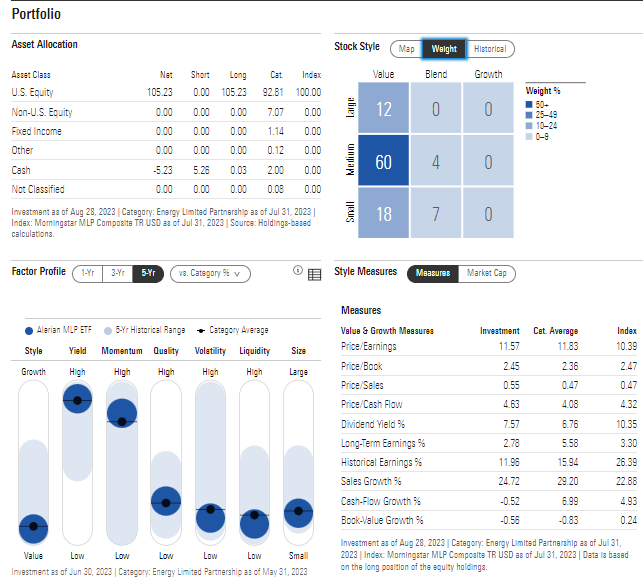
Morningstar
The portfolio holds just 14 companies, so it is a highly concentrated allocation. The top 10 positions make up more than 90% of the fund. Given the high expense ratio, investors could consider simply building this portfolio themselves or consider the lower-cost MLPA fund. Still, active investors can consider an overweight to AMLP given its number 1 ranking in its Sub Class, per Seeking Alpha’s Quant Rankings.
AMLP: A Very Concentrated Portfolio
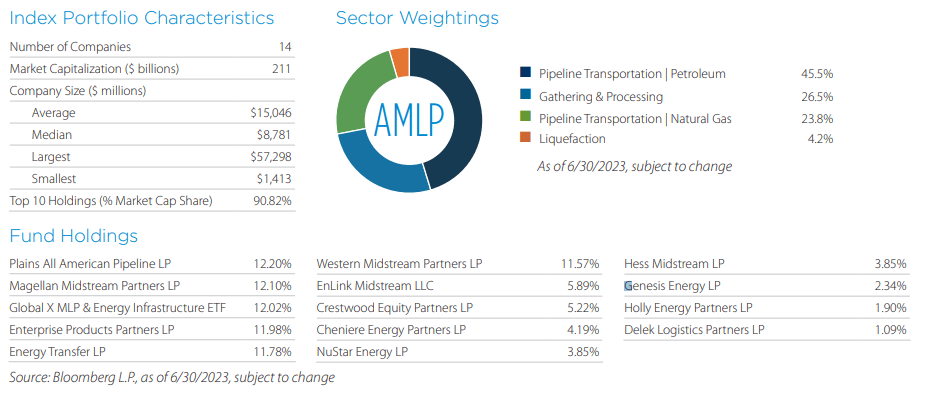
Alerian
Seasonally, AMLP tends to struggle from late August through mid-December, according to data from Equity Clock. So, it might be prudent to be tactical about when to go long shares as the volatile September and early Q4 gets underway.
AMLP: Bearish Seasonal Trends Through Mid-December
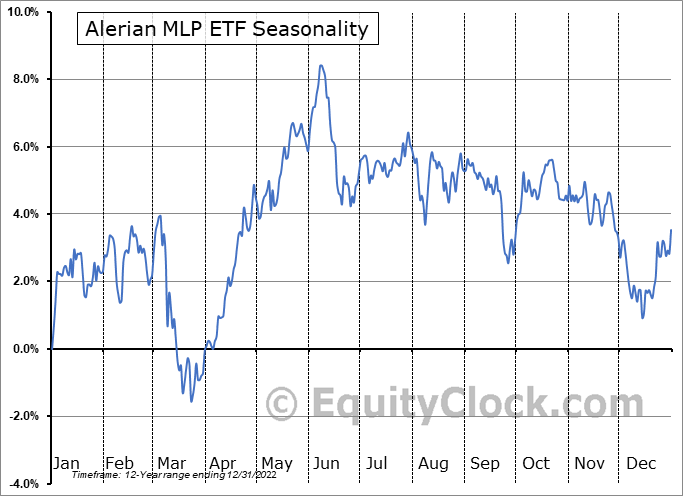
Equity Clock
The Technical Take
AMLP has been in consolidation mode for the better part of the last two years. Notice in the chart below that there’s resistance on the price-only view in the $41 to $43 area with uptrend support coming into play near $37. There is also a high amount of volume by price between $37 and $38, so any downside should be met with some buying support. Given that the RSI momentum indicator at the top of the chart is improving, that could be a telltale sign of an impending bullish upside price breakout.
Trend-wise, the long-term 200-day moving average is modestly upwardly sloped and the 50dma has been back and forth around the 200dma, but I like that the short-term line is above the 200dma. Also take a look at the volume profile – it has been trending lower since the first half of 2022, so if we see a price breakout on significant volume, that would be an added bullish sign.
Overall, the chart is encouraging from both an absolute perspective and relative to the broad market.
AMLP: Bullish Ascending Triangle, Improving RSI
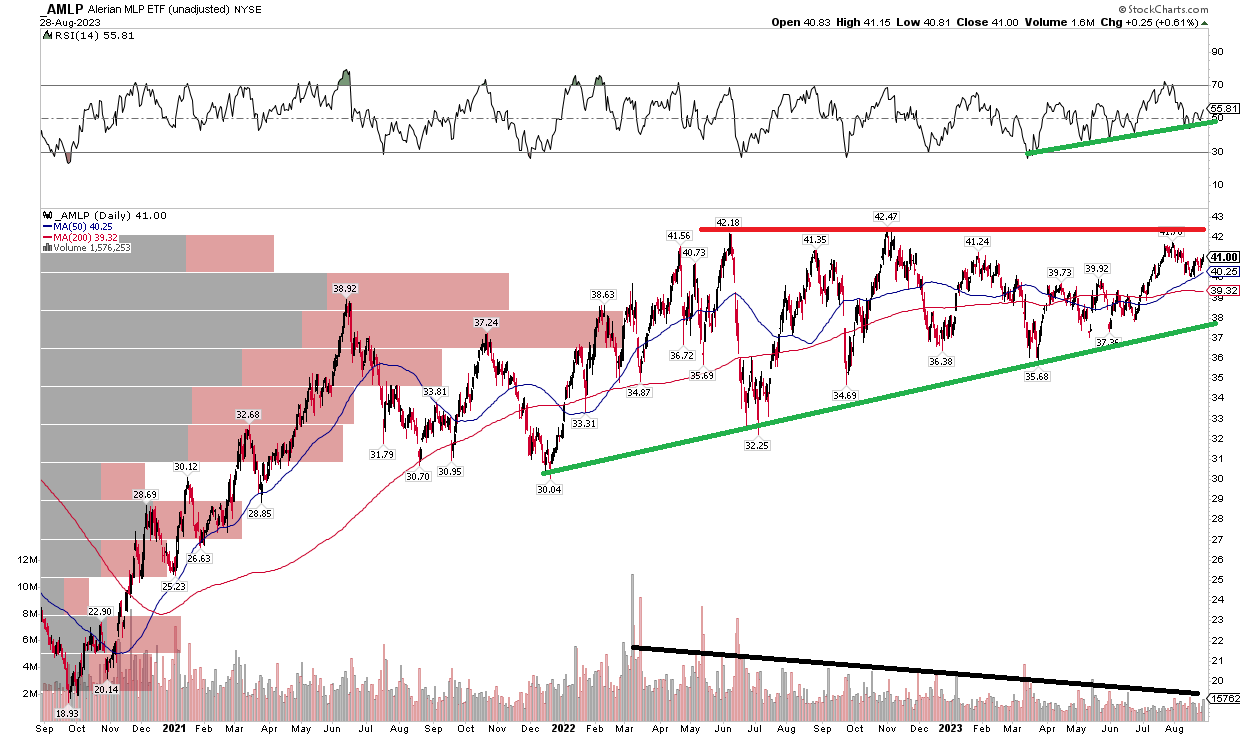
Stockcharts.com
The Bottom Line
I reiterate my buy rating on AMLP given its attractive valuation, high yield, solid momentum, and relative strength to the S&P 500.
Read More: AMLP: Shares Weathering The Summer Well, ETF Still A Bargain (NYSEARCA:AMLP)